mirror of
https://github.com/openobserve/openobserve.git
synced 2026-11-05 00:09:35 +00:00
3fda083f51d06b5ccf7520b5a5299c331dd84c2b
655
Commits
| Author | SHA1 | Message | Date | |
|---|---|---|---|---|
 ktx-vaidehi |
e490a5c347 |
fix(logs): load the stream list on Visualize when no stream is selected (#13812)
Entering Visualize from the logs page with no stream selected left the
Stream dropdown on "No options found" — enabled, openable, and empty, so
there was no way to pick one.

PanelFieldList defers its initial fetch in edit mode until a stream is
set, exempting only "metrics". The Visualize tab ("build") needs the
same exemption: its select is the user's own, and the list is keyed on
stream_type alone, so waiting for a stream buys nothing.

Also arms the stream_type watcher at mount, so changing Stream Type with
a blank stream now reloads the list instead of doing nothing.

- https://github.com/openobserve/o2-enterprise/issues/2165
|
||
 Bhargav |
e4503f7fcb | fix: Fix/match all pipe query corruption (#13764) | ||
  Amey PawarandHengfei Yang |
3d06ed0423 |
fix(logs): reject LIMIT in filter mode instead of building an invalid query (#13773)
Closes #6915. Without SQL mode the search bar's contents become the WHERE body of a generated `select [FIELD_LIST][QUERY_FUNCTIONS] from "[INDEX_NAME]" [WHERE_CLAUSE]`, and `handleNonSqlMode` splices the input in verbatim after stripping comments and quoting known field names. Nothing checks that the input is actually a predicate, so `k8s_namespace_name = 'nginx-ingress' LIMIT 10` produces valid SQL. The results grid runs it and returns rows, while the histogram query built from the same input is rejected by `is_eligible_for_histogram` and surfaces `SearchHistogramNotAvailable`. That is the split described in the issue — the log list works, the histogram errors. The server side of this already exists, so the guard belongs in the UI, before either request goes out. ## What changed | | | |---|---| | `utils/query/nonSqlLimit.ts` | new — `hasLimitClause()` | | `useSearchQuery.ts` | the guard in `handleNonSqlMode`, using the file's existing `notificationMsg` + `return null` path | Placement note: `hasLimitClause` lives in `utils/query/` rather than in the composable because it holds no state and touches no reactivity — the same split `doubleQuoteWarnings.ts` and `colorizeQuery.ts` already use. The check is deliberately narrow. `LIMIT` matches only when followed by a number, so `limit = 5` and `rate_limit >= 100` pass through. String literals are blanked first, so `msg = 'rate limit 500 exceeded'` is unaffected. Line and block comments are stripped after that, so `code = 200 -- limit 10` — which works today — keeps working. ## Tests - **17** on the derivation — the issue's own query, case variants, whitespace and newlines before the number, a bare `LIMIT 100`, a field named `limit`, `rate_limit >= 100`, the word inside a literal, a literal with a doubled quote, `limit = 'none'`, leading / trailing / block comments, a real LIMIT alongside a comment, and a dash sequence inside a literal. - **6** on `buildSearch` — rejects the reported query and sets the message, still builds without a LIMIT, allows `limit = 5`, ignores commented-out LIMITs, and does not fire in SQL mode. Each rejection test was checked to fail when the guard is reverted. The negative cases stay green either way, which is what separates them from tests that merely restate the implementation. ## Verification - `npx vitest run --root src/ composables/useLogs utils/query` — **1965 passed**, 33 files, 0 failed - `npx vue-tsc --noEmit -p tsconfig.vitest.json` — clean, and identical to `main` - `npx eslint` on all four files — clean - `npx prettier --check` — clean ## Caveats - Not exercised in a running app; covered by unit tests only. - `ORDER BY`, `GROUP BY` and `HAVING` reach the same splice and are **not** handled here. Happy to extend if you want them, but the issue asked about `LIMIT` and I didn't want to widen it uninvited. - `plugins/logs/IndexList.vue` holds an independent copy of the same `[WHERE_CLAUSE]` splice for field-value lookups. It is reached by clicking a field rather than running a search, so it sits outside this path — flagging it rather than changing it. --------- Co-authored-by: Hengfei Yang <hengfei.yang@gmail.com> |
||
  Prabhat Sharmaandgithub-actions[bot] |
360b989272 |
feat(slos): PromQL support for count and time-sliced SLOs, plus SLO/alert regression fixes (#13761)
Supersedes #13738, whose commit is included here as the first of four. Adds PromQL support to count and time-sliced SLOs, lets metrics streams choose SQL or PromQL, and fixes three shipped bugs found along the way. ## Shipped bug: every SQL time-slice SLO recorded wrong history `fetch_rows`' `SliQueryPlan::Single` arm normalized every hit with `with_good_column: true`, but that arm serves **two** shapes and only one projects `zo_slo_good`: | shape | projects | result | |---|---|---| | count single-query | `zo_slo_good` + `zo_slo_value` | correct | | time slice | `zo_slo_value` only | `good` defaulted to `0.0` | So every SQL time-slice slice was classified from `0.0` instead of its aggregate. With a positive threshold, `<`/`<=` (e.g. `p95 < 300ms`) recorded every slice **good** — the SLO read ~100%, the budget never burned, and no alert on it could fire. `>`/`>=` recorded every slice **bad** and fired continuously. Shipped in v0.92.0 (`4772df1723`); `to_row` had no time-slice test, which is how it got through. Fixed by deriving the flag from the SLI type in a new `single_query_rows`. Deliberately **not** fixed inside `to_row` by falling back to `total` — that would read a count bucket whose `SUM` came back NULL as *fully good*, inventing uptime. A test forbids it. **Stored history is not rewritten.** It ages out within one window; an operator can force a rebuild sooner by making a real edit (a no-op re-save does nothing — `update` bumps only on `definition_changed`). No auto-migration: bumping every time-slice SLO at boot would freeze every attached alert org-wide until backfill cleared the coverage floor, and double each org's row budget for 97 days — a self-inflicted monitoring gap to repair a reporting error. ## PromQL support **Time slice** carried a `query_language` field the planner ignored, so a PromQL time-slice SLO saved cleanly and measured nothing, forever. - `SliQueryPlan::PromQlValue` — one expression, not a good/total pair, planned at slice ends from the same helper the count arm uses. - The expression is passed through **verbatim**. Grouping comes from series labels; wrapping it in `sum by (...)` the way the SQL arm injects GROUP BY would destroy the aggregate (the sum of four pods' p95 is not a p95). - `promql_value_rows` **rejects** two series colliding on one `(slice_start, group_key)` via `RejectReason::AmbiguousSeries` instead of summing. Summing is right for counters (what `promql_rows` does) and meaningless here. Detection is unconditional, so the ungrouped case — an unaggregated `histogram_quantile` returning one series per instance — is covered. Rejects are plumbed through `fetch_rows` into `PassResult.rejected` on both the live and backfill paths. **Count** already had a working `CountSource::PromQl` backend that no UI could reach. ## Metrics streams choose SQL or PromQL `language_suits_stream` refused SQL whenever `stream_type == "metrics"`, and the form derived the language from the stream type — so metrics had no SQL option. A metrics stream is an ordinary stream with a `value` column, and `SELECT histogram(_timestamp, '5 minute'), avg(value) FROM cpu_usage` is a perfectly good SLI. SQL is now valid for any stream type; PromQL stays metrics-only. The form asks via a toggle (defaulting to PromQL) instead of deriving. ## Validation - `scope` refused for PromQL — a SQL `WHERE` fragment with nowhere to go in a PromQL plan. - Empty `query` refused for **both** languages (the SQL aggregate was previously never validated — same silent-freeze shape). - Expressions parsed with `promql-parser` at save, in `core` (`config` has no parser). - **Parse-only by design.** A grouping check requiring the root to be an aggregation whose `by(...)` matches `group_by` wrongly rejects `histogram_quantile(0.95, sum by (le, region)(...))` (function-call root; `le` is a necessary label superset) and binary-op roots like `sum by (region)(increase(a[5m])) - sum by (region)(increase(b[5m]))`. A "warn instead" variant needs a warnings channel the save API doesn't have. ## Also fixed - **Time-slice comparator 422.** `SliConfig::TimeSlice.comparator` has no serde default, so a dropdown the user never opened was omitted and the save died with a bare 422 — blocking creation of *any* time-slice SLO from the UI. Seeded to `<` only when blank, so a stored comparator survives an edit. - **SLO/alert/service-stream regressions** (the commit from #13738): fractional-threshold serde round-trip, `SloAlertCondition` UI, alerts table, service streams. ## Verification - 487 config · 206 core · 45 infra · 418 frontend — all passing; clippy `-D warnings`, `cargo fmt`, prettier, eslint, `vue-tsc` all clean. - Driven through a real browser against a running server (isolated instance, own data dir). All four SLI/language combinations create and store correctly: count·PromQL, count·**SQL over metrics**, time-slice·PromQL, time-slice·**SQL over metrics**. Also verified: the toggle swaps field shapes both ways, scope shows for SQL and hides for PromQL, PromQL-only hints appear only in PromQL mode, and editing a stored SQL-over-metrics SLO reopens as SQL with its predicate intact. - Validation rejections confirmed live with actionable messages: PromQL-with-scope, unparseable PromQL, and an empty SQL aggregate. Known limitation, pre-existing: `threshold` likewise has no serde default and is not seeded, so leaving it blank still 422s. That is genuine user error rather than an untouched-control trap; adding form validation was out of scope. 🤖 Generated with [Claude Code](https://claude.com/claude-code) --------- Co-authored-by: github-actions[bot] <41898282+github-actions[bot]@users.noreply.github.com> |
||
 Omkar Kesarkhane |
4b9204f69f |
feat(synthetics): collapse journey advisories into an on-demand suggestions chip (#13759)
## Problem

The browser journey editor stacked two **always-on** advisory cards
between the toolbar and the first step:

- *"This journey does not verify anything"* — no `assert` step in the
journey
- *"No test attributes found in this recording"* — no step produced a
`test_attribute` locator candidate

Both derived their visibility from the journey's own content, and both
conditions are the normal case for a real recording — so they rendered
on every visit to every affected journey. Each was dismissible, but
dismissal lived in a local `ref(false)`, so it died on remount: authors
closed the same two cards on every visit and still began reading their
steps two cards down the page.

## Change

One warning badge in the Steps toolbar — a warning icon and a count, no
prose:

- **Hover** names it ("1 suggestion for this journey"), from the same
string as the trigger's `aria-label` so the two cannot drift.
- **Click** opens a popover with each suggestion in full, separated by
rules, plus a footer stating that suggestions never block saving or
running.
- **Never opens on its own**, on any render.
- **No dismiss.** The chip costs no vertical space, so suppressing it
buys nothing — and a suggestion that can be waved away is one an author
never has to actually decline. A suggestion leaves when the condition
behind it is resolved.

A zero-assertion journey remains accepted with a warning; nothing here
blocks a save.

Transient banners are deliberately untouched — replay
running/passed/failed/stopped, incognito, pre-flight, recorder error.
They appear because something just happened, and a replay result that
does not announce itself is a worse product.

## Implementation

| File | |
|---|---|
| `web/src/utils/synthetics/journeySuggestions.ts` | new — pure
derivation over the steps; one small producer per rule; carries i18n
**keys** rather than text, so it needs neither Vue nor `useI18n` and a
rule is testable without mounting anything |
| `web/src/components/synthetics/journey/JourneySuggestions.vue` | new —
chip, tooltip, popover; presentation only |
| `web/src/components/synthetics/journey/BrowserJourney.vue` | computes
the suggestions, renders the chip in the toolbar, appends the offered
assertion |
| `ZeroAssertionNotice.vue`, `TestIdMisconfiguredNotice.vue` (+ specs) |
deleted — each was a visibility computation plus a card, and both halves
now have better homes |

Adding a future advisory is one producer and no template change.

Placement note: this lives in `utils/synthetics/` rather than a
composable because it holds no state and touches no reactivity — the
same split `deriveLocatorKind.ts` and `locatorStability.ts` already use
for derivations consumed by these components.

## Tests

- **17** on the derivation — both rules, empty journey, navigate-only
journey, empty candidate list, a test attribute outranked *within* a
step, both conditions at once in stable order, and that the offered
assertion is empty (`element_visible` with no selector/locator) rather
than guessed.
- **15** on the component — no chip at zero, count only and no prose,
pluralization, closed on mount, opens on click, tooltip suppressed while
open, action emits and closes, separators between suggestions.
- **5** on the `BrowserJourney` wiring — old hooks gone, suggestions
handed down, nothing offered when `readonly`, the assertion appended to
the tail with prior step order and ids intact, and the suggestion
dropping once the parent commits.

Two things the tests caught that review would not have:

1. Resolving the last suggestion unmounts the popover but not the
component holding its `open` flag — so a panel left open came *back*
open the next time a suggestion appeared. Regression test written,
confirmed failing, then fixed.
2. One component block runs against the **real** `OPopover` and `OBadge`
instead of a stub. `OBadge` declares `inheritAttrs: false` and the
popover trigger is `as-child` — precisely the pairing that silently
drops a click handler and leaves a chip that looks correct and does
nothing. Every other test stubs the popover and would not see it.

## Accessibility

`⚠ 1` has an accessible name of "1", so the trigger's `aria-label` is
load-bearing and carries the full count string. Child-mode tooltips are
pointer-only, so a keyboard user's path is that label plus the popover
they open with Enter.

Accepted trade-off, stated plainly: the old cards carried
`role="status"` and were announced on appearance. Nothing is announced
now — that announcement is what this change exists to suppress.

## Verification

- `npx vitest run src/components/synthetics src/utils/synthetics
src/views/synthetics` — 1147 passed, 58 files
- `npm run type-check` — clean
- `npm run lint` — clean for every touched file (the repo's pre-existing
`eslint.config.js` / `vitest.config.ts` findings are unchanged and
present on `main`)
|
||
 Ashish Kolhe |
de0d37e23d |
fix(alerts): stop losing Slack alerts on undeliverable link URLs (#13742) (#13753)
Fixes #13742 Fixes openobserve/o2-enterprise#2394 ## The bug A content template link with a non-http scheme (`javascript:alert(1)`) made Slack reject the **entire** notification with `400 invalid_attachments`. The alert was lost outright and `triggers` recorded `notify_failed`. ## Root cause `safe_url` neutralises a hostile scheme by substituting `BLOCKED_URL` (`"#"`). That is **safe** but not **deliverable** — Slack, Teams, Discord and PagerDuty validate action URLs server-side and reject the whole payload when one is not an absolute `http(s)` URL. A security substitution was turning into total message loss. The two properties are different, and links need both. So the fix splits by medium: | renderer | link handling | |---|---| | Slack buttons, Teams actions, Discord `embed.url`, PagerDuty `href` | `dispatchable_url` → **drop** | | HTML email, email plaintext, SNS plaintext, Discord description | `safe_url` → substitute `#` | | Webhook envelope | unfiltered — versioned machine contract, documented | Dropping beats rewriting: the alert body is worth more than the button, and a button pointing somewhere misleading is worse than no button. `dispatchable_url` requires a **non-empty authority**, not just an allowlisted scheme — `http:javascript:alert(1)` and `https://` are valid *opaque* RFC 3986 http(s) URLs that Slack still rejects. It also rejects raw spaces and control characters, which variable substitution can introduce. ## Related issues fixed in the same area - **Empty `ZO_WEB_URL`** (not in the report): `alert_url` becomes a root-relative `/web/logs?…`, which `safe_url` passes through by design, and it lands in the always-appended "View in OpenObserve" button. Same `invalid_attachments`, on deployments that never authored a hostile template. - **PagerDuty** validates `links[].href` server-side too — same lost-alert class, converted. - **Save-time rejection** (`ContentSpec::validate`): a clear 400 naming the offending link, instead of a template whose link silently never works. Also wired into **preview** and **test-send**, which previously accepted a draft that couldn't be saved and echoed the raw hostile URL back to the UI. - **Slack image-fallback misdiagnosis**: removing the image proves the image was at fault, but only an image pointing at *our* `web_url` justifies tripping the process-wide chart suppression (1h, across every alert) and telling the operator to fix `ZO_WEB_URL`. A custom template's third-party image no longer does either. - **a11y**: `OInput` links its error message to the control via `aria-describedby`; the textarea branch also gained `aria-invalid`. ## o2-enterprise#2394 (fixed here, not in the enterprise repo) Clearing the Monaco body and saving toasted "Please fill required fields" with no indication of *where*. The schema already produced an error on the `body` path — a bare Monaco bridged in via `setFieldValue` just had no `OFormInput` error slot to render it. Now a red border + message driven by the same field state `OFormInput` reads. The aria wiring goes on the **shell**, not on `<QueryEditor>`: `CodeQueryEditor` sets `inheritAttrs: false` and binds `$attrs` to a non-focusable wrapper, so attributes passed to the component would be inert — false assurance for a screen-reader user. > The issue names the title field too. It's an `OFormInput` and already highlights correctly; I added a regression test pinning that rather than changing it. This fix is entirely in OSS (`web/`) since the template form isn't enterprise-gated, so there's no companion enterprise PR. ## Layering note Save-time validation is a **UX gate, not the security boundary**. Link URLs are templates — a scheme that only materialises after `{variable}` substitution can't be judged at save time. The render layer is what actually stops delivery, and it also covers every template saved before this validation existed. Both layers are needed; neither is sufficient. ## Testing - Every fix written test-first (verified RED) and **mutation-tested** — each new test fails when its fix is reverted in substance. - Golden files unchanged: legitimate URLs render byte-identically, so no over-blocking. - Rust: `alerts::notifications` 159 · `config` 3130 · `api-management` 424 — all passing. `cargo clippy --all-targets` and `cargo fmt --check` clean. - Frontend: full suite **41,597 passing** (run because `OInput` is shared library code). `vue-tsc`, `eslint`, and `npm run format:check` clean. - Two independent cold-start review passes; findings from both are folded in, including a P0 where the first version of `dispatchable_url` still let the original bug through. Pre-existing and unrelated: `alerts::destinations::tests::test_alert_destination_template_is_optional` fails locally on a DB connection reset — verified failing on unmodified `main` too. |
||
 Abhay Padamani |
883fc97046 |
fix(dashboard): deduplicate panel and layout IDs on import and dashboard load (#13760)
https://github.com/openobserve/openobserve/issues/13104 |
||
|
Abhay Padamani
|
786f4f9f72 |
fix: dashboard label overlap issues (#13725)
1. <img width="727" height="242" alt="image" src="https://github.com/user-attachments/assets/2a84c1bf-2bc0-4fa7-aae5-e7801b99c93b" /> 2. <img width="167" height="380" alt="image" src="https://github.com/user-attachments/assets/6d937583-eb51-458c-8dac-fcf668f1f145" /> 3. <img width="1072" height="150" alt="image" src="https://github.com/user-attachments/assets/4f98ff15-06e4-45d2-a109-c84064cb644b" /> 4. <img width="32" height="289" alt="image" src="https://github.com/user-attachments/assets/9e4ef37f-2e9a-4259-9c6e-041946e1e380" /> 5. <img width="500" height="622" alt="image" src="https://github.com/user-attachments/assets/c4566094-6f58-4692-9ce8-bbcaf61026d7" /> 6. <img width="388" height="644" alt="image" src="https://github.com/user-attachments/assets/03e14424-a59a-4738-b0aa-1f70c7d207f6" /> 7. <img width="388" height="564" alt="image" src="https://github.com/user-attachments/assets/a1acded3-b2d6-4690-b2ba-47397f6a3fb4" /> |
||
|
ktx-vaidehi
|
43b531d996 | fix: build warning v2 (#13729) | ||
|
Prabhat Sharma
|
087e1498ab |
feat(slos): add SLO burn-rate alerts (#13704)
design at /slo ## What Adds **SLO burn-rate alerts** — an alert family that fires off an SLO's error budget rather than a raw query — and finishes the SLO surface around it: navigation entry, detail-page fixes, and the flag removal now that SLOs have shipped. ## Changes **SLO burn-rate alerts (backend)** - New burn-rate evaluation (`config/src/meta/slo/burn.rs`, `condition.rs`) with multi-window burn conditions, and `core/src/slo/evaluate.rs` extended to evaluate them on the SLO job. - Alerts carry an `slo_id`; `infra/src/table/alerts` gains the column, filtering, and query support so an SLO's alerts can be listed and deleted with it. - Alert levels (`meta/alerts/level.rs`) and tags extended for the SLO family; scheduler handlers route SLO alerts through the same notification path. **SLO alert UI** - `SloAlertForm` + `AlertDetailSlo`: create, edit and view burn-rate alerts from the SLO detail page and the alert list. - Payload/routing helpers (`utils/alerts/sloAlertPayload.ts`, `sloAlertRouting.ts`, `alertPayload.ts`) with unit tests. - `AlertDestinationsField` extracted as the complete Destination form field — side label, tooltip, combined destinations/workflows picker, inline error, refresh, and create-in-new-tab. It replaces two verbatim copies in the generic alert form and is reused by the SLO form and synthetics `CheckAlerts` (which sets `supportsWorkflows: false`, since a check has no workflow routing). Fixes the SLO form's previously unwired refresh and Add Destination buttons. **SLO detail page fixes** - Burndown and burn-rate charts drew as bare axes when coverage was sparse: `showSymbol: false` means an isolated measured bucket between gaps has no segment and paints nothing. Symbols are now sized per point, and a sparse-coverage note states how many buckets actually recorded events. - Nothing scrolled below ~700px of viewport height — `OPageLayout`'s fixed flex body plus `OTabPanels` `scroll="none"` clipped the panels. Panels now grow and scroll; the stat strip and tab bar stay pinned. Verified at 1024x500, 1280x620, 1512x945. **Other** - `ZO_SLO_ENABLED` removed — SLOs have shipped, so the flag and its status/route gating are gone. - SLOs surfaced in the main nav. - Dashboard chart panel header gets its own tint via new `--color-panel-bar-bg` / `--color-panel-bar-border` tokens, and the bar is extracted into `PanelBar.vue` (it existed as five hand-copied class strings that had already drifted). - `tsconfig.vitest.tsbuildinfo` untracked; third-party vendor name removed from comments and test names. ## Testing - New Rust tests across `meta/slo/burn.rs`, `condition.rs`, `core/src/alerts/alert.rs` and `infra/src/table/alerts`. - New frontend suites: `sloAlertPayload.spec.ts`, `sloAlertRouting.spec.ts`, `alertPayload.spec.ts`, `AlertDetailSlo.spec.ts`, `SloDetailAlerts.spec.ts`, `SloListDelete.spec.ts`, `SloTimeSlicePreview.spec.ts`. - `cargo clippy --all-targets` and `web` `lint:ci` clean. |
||
|
Bhargav
|
47d510aa16 |
feat: rebuild the RUM error detail page around issue impact (#13697)
Design at: designs/mobile-rum-sdk-evaluation/design-docs The page showed a single error event: header, tag strip, stack trace, replay button, event list. It could not say how bad the error was, who it reached, whether it was new, or where it concentrated — it never queried anything beyond that one row. It is now a two-column triage surface: the diagnosis path (occurrences chart, stack trace, breadcrumbs) on the left, corroborating evidence (replay, backend trace, breakdown, who hit it) on the right. - ErrorHeader: error type as the title with handling/source badges, the message in an alert banner, and a context line carrying event id, route and the service/version/env chips. Copy-permalink and copy-event-id actions. - ErrorImpactStrip: occurrences, users, sessions, first/last seen. A dash, not a zero, when a figure is unavailable. - ErrorOccurrencesChart: this signature over time, marking the bucket that holds the event the page was opened on. - ErrorFacetBreakdown: browser / OS / release / page as share-of-occurrences bars, calling out any value that owns 80%+ of the traffic — usually the fix. - ErrorContextCard: identity, device, geo and deployment for this occurrence. Supersedes ErrorTags, which is removed. Backed by useErrorDetail + errorDetailQueries: an impact aggregate gates a histogram and two facet group-bys. Three searches, staged inside the server's work-group cap and aborted when the view is left. Facets are split across two group-bys on purpose — one query over all four columns returns their cross product. Also fixes the breadcrumb trail: it read an hour of the whole stream with no session filter, so "what the user did before the crash" could be other people's clicks. It is now scoped to the session id. |
||
|
ktx-vaidehi
|
6c43e01823 | fix: px to rem (#13541) | ||
  
|
74805cf8ae |
chore(deps): update web npm dependencies (2026-08-06) (#13673)
## 📦 Weekly NPM Dependencies Update This automated PR updates `web/` npm packages to their latest versions and regenerates `package-lock.json`. ### Updated Packages - **@rudderstack/analytics-js**: 3.6.0 → 3.31.6 - **@tanstack/vue-form**: ^1.29.1 → ^1.33.3 - **@tanstack/vue-table**: ^8.21.3 → ^9.0.0 - **@tanstack/vue-virtual**: ^3.13.16 → ^3.13.35 - **@vue-flow/core**: ^1.48.1 → ^1.48.2 - **acorn**: ^8.15.0 → ^8.18.0 - **acorn-walk**: ^8.3.4 → ^8.3.5 - **cron-parser**: ^5.4.0 → ^5.7.0 - **date-fns**: ^4.1.0 → ^4.4.0 - **dompurify**: ^3.4.12 → ^3.4.13 - **gridstack**: ^12.4.2 → ^13.0.2 - **js-beautify**: ^1.15.4 → ^2.0.3 - **js-cookie**: ^3.0.7 → ^3.0.8 - **js-yaml**: ^4.3.0 → ^5.2.3 - **lucide-vue-next**: ^0.562.0 → ^1.0.0 - **marked**: ^17.0.1 → ^18.0.9 - **moment-timezone**: ^0.6.0 → ^0.6.3 - **monaco-editor**: ^0.52.2 → ^0.56.0 - **node-polyfill-webpack-plugin**: ^4.0.0 → ^4.1.0 - **reka-ui**: ^2.9.6 → ^2.10.1 - **reodotdev**: ^1.0.0 → ^1.1.0 - **sql-formatter**: ^15.6.12 → ^15.8.2 - **uuid**: ^14.0.0 → ^14.0.1 - **vue**: ^3.5.26 → ^3.5.41 - **vue-i18n**: ^11.2.8 → ^11.4.8 - **vue-router**: ^4.6.4 → ^5.2.0 - **@cypress/vue**: ^6.0.2 → ^6.0.3 - **@cypress/webpack-dev-server**: ^5.4.1 → ^5.6.2 - **@iconify-json/majesticons**: ^1.2.4 → ^1.2.5 - **@iconify-json/material-symbols**: ^1.2.72 → ^1.2.88 - **@iconify-json/octicon**: ^1.2.25 → ^1.2.31 - **@intlify/core-base**: ^11.2.8 → ^11.4.8 - **@rushstack/eslint-patch**: ^1.15.0 → ^1.16.1 - **@tailwindcss/postcss**: ^4.1.18 → ^4.3.3 - **@tailwindcss/typography**: ^0.5.19 → ^0.5.20 - **@tailwindcss/vite**: ^4.1.18 → ^4.3.3 - **@types/jsdom**: ^27.0.0 → ^28.0.3 - **@types/leaflet**: ^1.9.21 → ^1.9.22 - **@types/luxon**: ^3.7.1 → ^3.7.3 - **@types/node**: ^25.0.3 → ^26.1.2 - **@vitejs/plugin-vue**: ^6.0.3 → ^6.0.8 - **@vitejs/plugin-vue-jsx**: ^5.1.3 → ^5.1.6 - **@vitest/coverage-v8**: ^4.0.16 → ^4.1.10 - **@vitest/ui**: ^4.0.16 → ^4.1.10 - **@vue/eslint-config-typescript**: ^14.6.0 → ^14.9.0 - **@vue/test-utils**: ^2.4.6 → ^2.4.11 - **@vue/tsconfig**: ^0.8.1 → ^0.9.1 - **autoprefixer**: ^10.4.23 → ^10.5.4 - **c8**: ^10.1.3 → ^12.0.0 - **cypress**: ^15.19.0 → ^15.20.0 - **cypress-localstorage-commands**: ^2.2.8 → ^2.3.0 - **dotenv**: ^17.2.3 → ^17.4.2 - **eslint**: ^9.39.2 → ^10.8.0 - **eslint-plugin-cypress**: ^5.2.0 → ^7.0.0 - **eslint-plugin-vue**: ^10.6.2 → ^10.10.0 - **fs-extra**: ^11.3.3 → ^11.4.0 - **happy-dom**: ^20.8.9 → ^20.11.1 - **jsdom**: ^27.4.0 → ^30.0.1 - **msw**: ^2.12.7 → ^2.15.0 - **postcss**: ^8.5.10 → ^8.5.26 - **postcss-html**: ^1.8.1 → ^2.0.0 - **prettier**: ^3.7.4 → ^3.9.6 - **rollup-plugin-visualizer**: ^6.0.5 → ^7.0.1 - **sass**: ^1.97.1 → ^1.102.0 - **sass-loader**: ^16.0.6 → ^17.0.0 - **start-server-and-test**: ^2.1.3 → ^3.0.12 - **stylelint**: ^17.14.0 → ^17.14.1 - **vite**: ^7.3.2 → ^8.2.0 - **vite-plugin-istanbul**: ^7.2.1 → ^9.0.1 - **vitest-canvas-mock**: ^1.1.3 → ^1.1.4 - **vue-tsc**: ^3.2.1 → ^3.3.9 - **typescript**: ~5.9.3 → ~7.0.2 - **vitest**: ^4.0.16 → ^4.1.10 ### Validation This workflow does **not** run any checks — type check, unit tests and build all run as normal PR checks below. Review the results there before merging; a red check usually means one of the upgrades above needs to be pinned back or accompanied by a code change. --- 🤖 This PR was automatically created by the Weekly NPM Update workflow --------- Co-authored-by: Bhargav <551527+bjp232004@users.noreply.github.com> Co-authored-by: Bhargav <BJP232004@GMAIL.COM> Co-authored-by: ktx-abhay <abhay.padamani@kiara.tech> Co-authored-by: Abhay Padamani <141122205+ktx-abhay@users.noreply.github.com> |
||
|
Abhay Padamani
|
79fbd566b3 | fix: ai page improvements (#13689) | ||
 Bhargavandktx-akshay |
93cfbee117 |
fix: Issue ent 2343 alert improvements v3 (#13670)
Co-authored-by: ktx-akshay <akshay.patil@kiara.tech> |
||
|
Abhay Padamaniandktx-akshay
|
739054c7bd |
feat: metric chart improvement (#13546)
Design At: designs/dashboards/metric-chart-override-support/ 1. For metric chart conditional text color, background color, value override support. 2. sparkline for metric chart. --------- Co-authored-by: ktx-akshay <akshay.patil@kiara.tech> |
||
|
Ashish Kolhe
|
bafc2be4f0 |
fix(correlation): P0/P1 fixes from service-streams correlation review (#13668)
## Summary OSS half of the correlation P0/P1 fix set from the line-by-line review (`docs/ak_review/correlation-line-by-line-review-2026-08-06.md`). Companion enterprise PR: same branch name in o2-enterprise (required for CI manifest pairing). ### Fixes (by review finding) | Finding | Fix | |---|---| | **F14** | `StreamInfo.dropped_dimensions` contract field (`#[serde(default, skip_serializing_if)]`, backward-compatible wire format) + TS type | | **F8** | Shared coverage-based identity-set ranking (`resolve_best_set_by_coverage`) in `config::meta::correlation` — full coverage > ratio > count, declaration-order ties; ingest and read now rank identically | | **F10** | `save_identity_config` purges rows of removed/changed sets (`obsolete_set_ids`) + cache clear + org reload event | | **F6** | `_reset` routes through enterprise `ServiceStorage::delete_all` (cache clear + super-cluster replication) and emits an org-scope reload; super-cluster Delete consumer emits org reload instead of per-service delete | | **F19** | `infra::table::service_streams::put`/`delete_subset_orphans` return deleted orphan disambiguations so callers can evict cache keys | | **F2** | `config::utils::sql::validate_where_fragment` (sqlparser) applied to the `filter` param at both `traces/latest*` interpolation sites — statement smuggling and comment-truncation payloads → 400 | | **F2/F38** | FE: shared `quoteSqlIdentifier`/`quoteSqlLiteral`/`buildSqlCondition` adopted by all six SQL builders (two trace paths were fully unescaped) | | **F35** | `applyFilterOverlay`: filter edits resolve per-stream via semantic groups instead of literal key identity; dead `removeFilter`/`resetFilters` removed; `semanticGroups` threaded to `CorrelatedLogsTable` parents | | **F36** | `applyDimensionEditsToFilters`: dimension-bar edits work in both key spaces (raw-field and semantic-ID), case-insensitive shared field→group map | | **F31** | `mergeSubjectOverrides`: subject overrides replace the same-group key (never union two aliases into contradictory WHERE), schema-less field guessing removed | | F14 (FE) | Warning banner shipped, then removed by reviewer decision (`dropped_dimensions` stays in the API) | ### Verification - `cargo test -p config` correlation/service_streams/sql: 121 tests green; enterprise-feature and OSS-only cfg builds both compile - FE: 263 vitest tests green across the correlation suites; vue-tsc clean - **Live-verified** against a local build (fresh DB): 19/19 API checks (raw-value emission, set filing, obsolete-set purge, reset cache invalidation, orphan eviction, filter validation) plus browser checks (escaped SQL on the wire: `"environment" = 'Prod-EU'`) Deliberately out of scope (per review decision): F15, F17/F37, F9. |
||
|
Shrinath Rao
|
c9f68754df |
fix(logstream): show local timezone in stream detail time range (#13652)
## Problem The **Stream Detail** header shows the stream's document time range with a timezone badge that is **hardcoded to \`UTC\`** (i18n key \`logStream.utc\`), while the timestamps next to it are rendered by date-fns \`format()\` in the **browser's local timezone**. So the badge and the value disagree for any non-UTC user — the range reads as local time but is mislabeled "UTC". ## Fix - Add \`formatTimestampInTimezone(us, format, timezone)\` in \`web/src/utils/date.ts\` — same as \`formatTimestamp\` but renders in a given IANA zone (via \`date-fns-tz\` \`formatInTimeZone\`, already a dependency), matching the pattern already used across dashboards. - In \`schema.vue\`, add a \`displayTimezone\` computed = \`store.state.timezone || <browser zone>\` (never a hardcoded "UTC"), render it in the badge, and format the \`doc_time_min\`/\`doc_time_max\` range in that same timezone. Now the badge label and the displayed range always use the same timezone — the user's selected timezone, falling back to their browser zone. ## Scope note The separate **Extended Retention** date picker further down still uses UTC intentionally (retention day-boundaries are computed in UTC on the backend), so its \`(UTC Timezone)\` label is left unchanged. ## Validation Verified \`formatInTimeZone\` behavior against the installed \`date-fns-tz@3.2.0\`: | timezone | rendered value | |---|---| | UTC | \`2025-08-03T20:03:22:99\` | | Asia/Kolkata | \`2025-08-04T01:33:22:99\` | | America/New_York | \`2025-08-03T16:03:22:99\` | Label and value now agree in every case. |
||
|
Bhargav
|
bbf2aa37af |
feat: Issue ent 2289 mobile rum sdk error tracking v2 (#13645)
Design at: designs/tree/main/mobile-rum-sdk-evaluation/design-docs |
||
 ktx-vaidehiandKirtan Thakkar |
3285a31e6f |
fix: i18n lint enforcement (#13439)
Co-authored-by: Kirtan Thakkar <kirtan@kiara.tech> |
||
 Sai Nikhil |
76f1df06fa | fix: alert timezone fix on main (#13519) | ||
|
Omkar Kesarkhane
|
1ec3b5d0dc |
fix(synthetics): make journey validation errors reach the step they name (#13616)
## Problem

Saving a browser check with an invalid step showed only the toast **"Fix
the highlighted fields before saving"** — no step expanded, no field
highlighted. Two separate faults produced that symptom.

### 1. In create mode, nothing reached the journey at all

`OStepper` runs in **wizard mode** here (no `expanded` prop, default
`false`), so `OStep` renders its panel behind `v-if="isActive"` —
**`BrowserJourney` exists only while `currentStep === 1`**. Create
mode's only Save button lives in the `currentStep === 2` footer, so
`journeyRef.value` was `undefined` when `persist()` ran:

```ts
currentStep.value = 1;                                        // not flushed yet
journeyRef.value?.validateStepSelectors?.();                  // no-op
journeyRef.value?.setStepFieldErrors?.(result.error.issues);  // no-op
toast({ variant: "error", … });                               // the only survivor
```

A `nextTick` would not have been enough: a **freshly mounted**
`BrowserJourney` starts with an empty error map, so an imperative push
cannot survive the remount. Edit mode worked because it has a Save on
the Journey step — which is why this read as create-mode-only.

### 2. Even when they arrived, only 2 of 7 rules expanded anything

Auto-expand lives in `validateJourneySteps()`, which knows two rules.
The other five — `stepNameRequired`, `retiredAction`, the navigate URL,
`typeTextRequired`, `expectedRequired` — live in the zod schema and
reached the journey through `setStepFieldErrors()`, which recorded the
message and returned. `getRowStatusColor()` ignored them too, so
"highlighted" was literally false for those rules.


## Fix

- **Issues are parent-owned state passed as the `fieldIssues` prop**,
applied by an `immediate` watcher. Mount order stops mattering — issues
raised while the journey is unmounted wait, and rows open whenever it
next renders (including the Details-error + journey-error case, where
the author lands on Configure and finds the journey already expanded on
switching tabs).
- **Both paths route through `revealErroredSteps()`** — opens every
errored row in journey order, clears an active filter (a filtered-out
row isn't rendered, so expanding it shows nothing), scrolls to the
first. `getRowStatusColor()` reads schema errors too.
- **Stale errors clear as the author edits.** The editor emits no
per-field event for name/value/expected, so those stayed red over
corrected input and kept re-opening a correct row.
- **Stale errors clear on a successful save** — `setStepFieldErrors` was
only ever called on the failure branch.
- **Duplicate error toast gone.** `persist()` no longer calls Path A at
all; the schema already emits both of its rules as field issues.

Removed as dead: `setStepFieldErrors` from `defineExpose`, and the
`silent` option added mid-fix for the duplicate toast.

## Tests

846 passing. Validation had large untested surfaces — which is how
coverage decayed without a single failure. Closed here:

- monitor-level `name`/`url`/`locations` and the **entire gate schema**,
neither ever exercised (`form()` supplies valid values; the view spec
replaces the schema module with a stub)
- `validateJourneySteps`' auto-expand — **untested since the first
commit**
- the `expectedErrorMessage` binding, `.trim()` on type text and
expected, the `\S+$` part of the navigate regex, `element_not_visible` /
`page_title` / `element_attribute`, and the `scroll`/`screenshot`
retired actions

The view spec's `OStep` stub was `v-if="$parent.$parent || true"` — it
rendered **every** panel, keeping `journeyRef` alive on the Configure
step, which is why this spec could not have caught fault 1. It now
mirrors wizard mode, and a create-mode save with a journey error is
asserted end to end.

**Every rule verified by mutation** — disabled at source, suite re-run,
reverted. **33 mutations, all caught.** Three initially ran green and
led to stronger tests: `min(1)` on `url` only governs *which message*
appears (the protocol refine rejects `""` anyway), nothing reached
`\S+$`, and `validateJourneySteps`' expand had no test at all.

## Not fixed — filed for follow-up

Found in the same sweep, deliberately out of scope:

- **`select` / `press` / `upload` accept a blank value.** `v2Value()`
maps all of them to the wire, so they save, run, and **pass** — the
false-green `typeTextRequired` exists to prevent. `type` isn't special;
it just got a rule.
- **A zero-step journey saves.** No `.min(1)`, and the first-step check
treats an empty array as valid.
- **`element_attribute` has no attribute rule**, and no error binding
for that field.
- **`timeout` / `settle.budget_ms` warn but never block.** Needs
`Advanced` to become controlled first, or the rules land inside a
collapsed section and reproduce this same bug one level deeper.
- **Continue and Replay use the 2-rule gate**, not the schema — so a
journey with a blank type text replays and false-greens.
- **A whitespace-only monitor name is accepted** (`.min(1).trim()` vs
the step rule's `.trim().min(1)`), so a check named three spaces saves
and displays blank.

Full write-up with the regression timeline, the mutation table, and why
each layer's tests stayed green is in
`docs/synthetics/002-journey-step-validation-audit.md` (untracked —
`docs/` is gitignored in this repo).

## Verification

- `npx vitest run src/components/synthetics src/views/synthetics` → 43
files, **846 passed**
- `npm run type-check` → clean
- `npx eslint` on changed files → 0 errors (4 pre-existing warnings,
none introduced)
- `npx prettier --check` → clean
|
||
|
Prabhat Sharma
|
624425a08a |
feat(editor): rebuild query autocomplete, and fix the value path behind it (#13586)
Design at autocomplete/autocomplete.md

Rewrites the query editor's autocomplete across every surface that has
one, and
follows the field-value path far enough to fix the bugs it was hiding.
53
commits, in six phases; each phase was written test-first, reviewed
adversarially, and checked in a browser before the next one started.

## What was wrong

The completion providers were wired inconsistently. Six surfaces bound a
resolver that was never defined, so their value completion could not
resolve at
all — SLO, dashboards and anomaly detection among them. Traces never
bound
`:suggestions`. Alerts never called `updateStreamKeywords`. PromQL ran a
second
editor runtime purely for its grammar, and asked
`/prometheus/api/v1/series`
— the heaviest endpoint available — for data the stream schema already
has.

## Phases

**1 — icons, staleness, quoting.** Correct `CompletionItemKind` glyphs,
stream
keywords refreshed when the stream changes, `spath` quoting.

**2 — the function catalog.** Custom functions get one tab stop per
argument,
org VRL functions stop appearing twice, column types read from
`dataType` as
well as `type`.

**3 — signature help, hover, async completion.** Providers return real
`CompletionList`s with `incomplete: true`, so a list that arrives late
is
re-queried rather than pinned.

**4 — numeric ranking.** Numeric columns sort first inside a numeric
aggregate.

**5 — values for streams nobody has searched.** The value cache only
ever held
what a search had already returned, so a stream you had not queried
offered
nothing. Values are now fetched on demand, bounded (10s timeout, 60s
cooldown,
one in-flight request per key), and shared between the editor and the
builder.
PromQL joins the same path: labels from the stream schema, values from
the
shared cache. `/series` now has zero production callers.

**6 — one way to fetch a value.** Item 22 only, in this PR.

## The dashboard filter 400

Clicking the ✕ beside "Select Field" in a filter's dropdown sets the
column to
`{}`, and the watcher on `condition.column` then asks for that column's
values.
`loadFilterItem` built `fields: [row.field]` out of `undefined`,
JSON.stringify
turned that into `null`, and the server answered

```
400 {"code":400,"message":"SerdeJsonError# invalid type: null, expected a string"}
```

`_values_stream` answers 400, not an empty result, for each way a piece
of the
payload can go missing — and every one is reachable: an unresolved
stream alias
(`.find(…)?.stream`), a stream not yet chosen (`""`), a range not yet
set. The
range fails differently: `meta.dateTime` starts as `{start_time: ""}`
and
`""?.toISOString()` does not short-circuit, so it throws and both
callers
surface "Something went wrong!" for a lookup the user never asked to
fail.

Guarded at the two callers, where the payload is built and where the
throw
happens. Not at `fetchFieldValues` — a guard there is too late to stop
the
throw and would duplicate validation the callers need anyway. The
trigger is
left alone: re-picking a field must still load its values.

## Notable removals

CodeMirror is gone — it was still bundled for the PromQL grammar alone.
Bundle 26.3 MB → 25.43 MB; the PromQL chunks 442.7 KB → 20.6 KB. The
PromQL
term catalog went from 7 entries to 113, generated from Prometheus's own
tables
and vendored with its MIT notice.

## Verification

- 76 files, +10.5k/−1.4k, ~9,100 tests passing across the touched areas.
- `vue-tsc` clean, `npm run build` exit 0.
- Every phase checked in a running browser against a live instance,
including
the 400 above: the ✕ now produces no request and no toast, adding a
filter and
re-picking a field each still fetch once, and the value list still
populates.

## Known, deliberately out of scope

- A filter still fetches twice (once on add, once on open) — that is
item 23,
  the cache read, not this PR.
- `useMetricsExplorer.loadFilterItem` has the same unguarded
`toISOString()`
  pattern on a different surface.
- `services/metrics.ts` and `services/search.ts` still carry dead
  `get_promql_series` wrappers now that nothing calls `/series`.
|
||
|
Omkar Kesarkhane
|
fc8e3c1657 | fix: redesign the step editor and the run evidence surfaces (#13582) | ||
|
Ashish Kolhe
|
23e816b1e4 |
feat: External Alert Sources incident ingestion (#13578)
## Summary Adds a full "External Alert Sources" feature so OpenObserve Incidents can serve as ingestion/correlation layer for third-party alert tools (Grafana, Alertmanager, generic webhooks): - Token-authenticated inbound webhook endpoint (`o2iat_` tokens) that normalizes Grafana/Alertmanager/generic payloads and correlates them into Incidents alongside internally-generated alerts. - Incident integrations CRUD (create, list, enable/disable, rotate token, delete — default integration protected from deletion) with per-sender observed status. - Settings UI: single always-open alert sources table (merged from an earlier two-panel design), shared-token badge, add/rotate/delete flows. - Incident detail UX: contributing-alert Source/Labels columns, "view raw payload" action (surfaces the exact webhook JSON received), and an external-source badge on the incident header so it's obvious at a glance whether an incident has external contributors. - **Auto-resolve**: incidents now close automatically once every contributing external alert reports `status: resolved` — previously required manual resolution even when the source alert cleared. ## Notable follow-up fixes bundled in - Rebased onto latest `main`; repaired two build breaks surfaced by upstream changes that landed after this branch diverged (`CorrelationSubject` refactor's new `eval_level` param, and a new `SeverityEscalated` correlation outcome) — both textually merged clean but were semantically incomplete for the external-event path. - Removed the `O2_INCIDENTS_EXTERNAL_SOURCES_ENABLED` enterprise config flag (companion removal in o2-enterprise) — external sources are now gated solely by `O2_INCIDENTS_ENABLED`, removing a redundant toggle. ## Test plan - [x] `cargo build --no-default-features --features enterprise` — clean, no warnings introduced - [x] `cargo clippy` on touched crates (`infra`, `openobserve-core`, `openobserve-api-management`, `openobserve-api-http`) — no new warnings - [x] `cargo fmt --check` — clean on all touched files - [x] `cargo test` — all tests in touched modules pass (`alert_incidents`, `incident_integrations`, `external_alerts`, `alerts::*` — 274/274); two unrelated flaky DB-pool-timeout tests (`db::tests::test_delete`, `table::ratelimit::tests::test_add_batch_missing_rule_id`) confirmed pre-existing and pass in isolation - [x] Frontend: `vitest run` on all touched components — 156/156 passing; `vue-tsc --noEmit` clean - [x] Manually verified end-to-end against a running dev server: fired/resolved external alerts, confirmed auto-resolve, delete, and raw-payload retrieval all work against real HTTP calls |
||
|
Prabhat Sharma
|
0cfa518433 |
feat(slos): SLO measurement UI — trend charts, previews, and slice defaults (#13579)
## What this is The SLO measurement UI: the Reliability nav entry and SLO routes, the list and detail pages, the create/edit form, and the trend charts that make an error budget readable. ## The charts The detail page draws **burndown** and **burn rate** side by side. They read the same slices and differ only in the window they aggregate over, which is what makes the pair legible: burn spikes above ×1, budget bends downward. Each panel carries a **second y-axis** that relabels the first through a fixed affine map — a burn multiple *is* an SLI, a share of budget *is* a number of errors. This is not the dual axis that makes crossing points an artifact: there is one series, and the right axis is the same axis in the unit people speak in. The SLO is written as "99.9%", and "we can afford 12 more errors" is a sentence an on-call engineer can act on. That demands exact gridline alignment, so `chartScale.ts` pins the left axis and *derives* the right one. Two consequences worth knowing: - **Precision follows the axis step, not the unit.** A four-nines target leaves a 0.01-wide budget, so its SLI axis moves in thousandths — two decimals would print every gridline as "100.00%". - **The burndown's top is pinned at 100**, not rounded up to a multiple of its step. A window 1,500% overspent takes a 500-point step, and rounding the top squashed the whole healthy stretch of the line into the top fifth of the panel. An info tooltip on each panel gives the plain reading, the formula, and how to read the threshold line. The formulas mirror `toBurndownSeries` (and so `config::meta::slo::math`) exactly — two statements of "burn rate" that disagree by a rounding convention is a support ticket. ## Previews in the form A count SLI is a **predicate** and the doubt is whether it parses; a time-slice SLI is a **number** someone has to guess (232 ms) and nothing told them whether that makes 1% or 40% of slices bad. Each now gets the preview that answers its own question, and the time-slice one puts the verdict in the header — "83.3% good — 5/6 slices" — beside the target just typed. The threshold never reaches SQL, mirroring the ingest pass, which aggregates first and classifies after so a threshold edit re-reads stored slices instead of contradicting them. Dragging it therefore rescores instantly with no query. The aggregate field moves from a bare input to the same expression editor scope and good-when already use — it names a column, and a mistyped column is invisible until the ingest query fails. ## Defaults **5-minute slices are now the form default.** For a count SLI the slice width does not touch the arithmetic — the window SLI is Σgood/Σtotal and repartitioning the same events changes neither sum — so 60s returned bit-identical numbers for five times the stored rows (139,680 per series at the 97-day horizon against 27,936). 60s stays available because for a time-slice SLI the width *is* the definition: at 99.9% over 7 days a single bad 5-minute slice spends about half the budget. Backend validation is untouched; both widths remain legal. ## Verification Beyond unit tests, the charts were rendered against a live instance, which caught three defects the tests could not: - The burndown's second axis counted **seconds** for time-slice SLOs while labelling them slices — off by 300× (2,340 shown where the honest answer is 7.5). Now converted via a tested `budgetUnitsFor`. - `histogram()` returns `slice_start` as an ISO string without a zone marker. `Number()` gave NaN (empty panel forever); parsing as local time would have shifted the series by the viewer's offset. - The preview's result set is not the range — a slot with no rows produces no row at all, so the tally read over an undisclosed sample (4 of 12 slots on a 7.3%-coverage SLO). The gap count is now stated, and the pass/fail colour is withheld below ten measured slices rather than calling 66.7% a failure on the strength of three. `npm run lint`, `vue-tsc`, `lint:design:strict` and the `utils/slos` suites all pass. ## Known follow-up, deliberately not in here SQL function autocomplete renders its whole call as the label, uses the "abc" (Text) icon, and inserts a literal `'undefined'` for any function taking more than one argument — the provider passes one argument to a label builder that takes several. It is app-wide (`useSuggestions.ts` + `CodeQueryEditor.vue`), not SLO-local, so it wants its own change. |
||
|
Prabhat Sharma
|
8f60dbcc82 |
fix(metrics): widen rate windows when the scrape interval overstates cadence (#13576)
## Problem Metrics explorer cards for histograms, counters, and summaries showed **"Too few samples for a rate"** even though the streams had data. The rate window is sized from the org's configured `scrape_interval` (e.g. 15s → `[1m]`), but when data actually arrives less often (the OTel demo app exports every 60s), `rate()` almost never finds the two samples it needs — so every rate-based card rendered the sparse message while gauges charted fine. Reproduced against a live instance: `sum(rate(app_cart_add_item_latency_count[1m]))` → empty; the same query with `[4m]` → `0.172/s`. ## Fix **Widened-window retry** (`useMetricsExplorerGrid.ts`, `computeWidenedRateWindows` in `metricDefaults.ts`): when a rate-based card comes back empty but the presence probe confirms samples exist in the window, retry with geometrically wider windows — 4×, then 16× the standard window, capped at half the range — and chart the first rung that answers. The sparse message now only appears when no honest window could produce a chart. **Editor / dashboard handoff** (`MetricsExplorer.vue`): the drill-in normally hands the editor `$__rate_interval`, which resolves from the same overstated scrape interval — opening a blank editor for a metric the card visibly charts. The preview now remembers which rung worked (`widenedRateWindow`, persisted through the card cache like `nanGuardApplied`), and both the card→editor drill-in and the favorites→dashboard conversion hand over that concrete window instead. Cards that never needed widening keep the adaptive `$__rate_interval` behavior. Supporting changes: - `previewKeysOf` enumerates the widened query keys so refresh invalidates them instead of replaying stale retries from the queue cache. - Persisted-cache identity gains a shape version (`v: 2`) so pre-field entries (widened data with no memory of the window) miss once and re-learn live. - A failing widened retry settles for the sparse answer already in hand rather than repainting the card as an error; cancellations still abort. - During a refresh the loading state carries `widenedRateWindow` alongside the old results it keeps on screen, so a mid-refresh drill-in stays correct. ## Verification - Unit tests: retry ladder math (caps, dedup, no-room-to-widen), first- and second-rung success, all-rungs-fail keeps the sparse card, window carried on the preview, handoff passes the concrete window vs `$__rate_interval` — 182 tests across the four spec files pass; ESLint and vue-tsc clean. - Live against a dev backend: previously-sparse `app_cart_*` cards all render (network log shows `[1m]` → empty, presence probe, `[4m]` → data); drill-in opens the editor seeded with `sum(rate(...[4m]))` and a rendered chart, from both the live-query and cache-restored paths. |
||
|
Omkar Kesarkhane
|
bbed40d8f4 |
feat(synthetics): author-owned locators, and step-scoped run evidence (#13563)
## Summary

Three synthetics workstreams on one branch: author-owned locators (Phase
2b), retirement of version-1 monitors (Phase 2c), and making a failed
browser step diagnosable without leaving the Steps tab.

Everything else in the synthetics suite passes (422 tests across the 21
suites the evidence work touches).

## Author-owned locators (Phase 2b)

The recorder proposes a locator bundle; the author owns its order.
Schema, combined-locator build/read, provenance pinned across the
recorder bridge, and the payload contract tested from both sides.

`337911158d` `e63f8f429f` `50b811a865` `2a978b9408` `c8c081c3c5`
`35ef1c36cb`

## Version-1 retirement (Phase 2c)

Stop creating v1 monitors, delete the v1 migration path and its step
fields, drop `steps_version` from the schema.

`b58b03077d` `75984ad222` `68a33e885d` `a2bffae7b7`

## Run detail — evidence, scoped to the step

Implements §5.3 of `docs/synthetics/step-failure-evidence-design.md`
("render the bundle, scoped to the step"), which was specified and never
built: only the kind-grouped run-level Evidence tab shipped.

**Per-step page activity.** The expanded step now shows the
`evidence.ndjson` events attributed to it — severity-ranked, capped at
5, with "View all N →" deep-linking into the Evidence tab pre-filtered
to that step. One shared `OTable` wrapper renders rows for both surfaces
so they cannot drift, and one composable fetches the bundle once for
both.

`a483796d57` `a7cbe0a3e0` `f63973285e` `eb7ec4f3e6` `1ed226febe`
`e3d969bcb2`

**Settle signals were attributed to the wrong step.**
`failure_detail.settle_signals` accumulates across the whole journey. On
live run `3HFCZ3fm` it held 13 signals — one from step 2, six from step
8, two from step 14 — while the failed step 15 owned none of them, and
the panel rendered all 13 under step 15. The signal that mattered
(`stale POST **/_search_stream, 30274ms`) belongs to step 14, which the
run's own error string says, and step 14 displayed nothing.
`last_attempt_steps[i].settle_signals` had carried correct per-step
attribution all along and was read by nothing.

`6ba6f8d633`

**Artifact URLs carried no origin.** `artifactUrl()` returned a bare
path while every other call in that service goes through `http()` with
`baseURL: store.state.API_ENDPOINT`. Artifact URLs go to `<img src>` and
`fetch()` directly, so in dev they resolved against Vite on `:8081`,
which has no `/api` route and no proxy — every screenshot and evidence
bundle 404'd. Verified against a running backend with a real key:
`:8081` → 404, `:5080` → 200. Production, served from the API's own
origin, is unchanged.

`baa7407cb5`

**The locator ladder was invisible.** `candidates_tried` lists only the
rungs the probe stood on, so a step that matched on its primary looked
identical to a step that had no second candidate — both one row, both a
grey `used_as_primary` badge. On live run `3HGDMrlU` the failing assert
had one authored locator and every `assert`/`fill` step in that journey
is built the same way, while `click` steps average 2.4 candidates. The
section now leads with "N of M tried", names a one-rung ladder as having
no fallback, labels outcomes in words instead of enum values, and dims
unreached rungs the way the timeline dims a skipped step.

`c05e1ce133`

## Test plan

- `npx vitest run src/views/synthetics src/components/synthetics/results
src/components/synthetics/StepEvidence.spec.ts
src/composables/synthetics src/composables/useSyntheticEvidence.spec.ts
src/services/synthetics.spec.ts` → 422 passing
- `npm run type-check` → clean
- `npm run lint:design:strict` → 2 pre-existing regressions above (see
Known failing)
- Behaviour on the run-detail changes was verified against live records
from `OpenObserve Sys Query` and `OpenObserve Cloud Happy Path` rather
than fixtures alone

## Not covered

- The "Add a fallback locator" action from the locator-ladder work needs
a step-level deep link; `synthetics/edit/:id` has no step anchor, so the
warning states the finding without an action.
- Browser-level confirmation of the artifact-URL and locator-ladder
changes is outstanding — the local backend's search service was
returning `tcp connect error` during verification, so those two were
confirmed against records and by unit test rather than in a running
page.
|
||
 
|
073c5c2680 |
feat(ui): calm-signal pass over Streams, Pipelines and Cluster Nodes (#13562)
Continues the "Calm Signal" colour language shipped on the Alerts list: a calm neutral canvas, with saturated colour spent only on the one signal each screen exists to surface. These three pages were picked from a ranked audit of the remaining list screens. ## Streams — `web/src/views/LogStream.vue` Signal: **ingestion liveness**. - **Last Ingested** column — relative time from `stats.doc_time_max`, with a dot on streams taking data within the hour. - **Liveness row rail** — green (ingested today) / amber (was ingesting, quiet for over a day) / grey (never ingested). Grey rather than amber for "never": a brand-new or schema-only stream is legitimately empty, so amber there would cry wolf on every fresh stream. No full-row wash — a stream list has no outright failure state, and washing "quiet" or "empty" would tint most rows in a normal org. - **Compression** column from ingested/compressed size, coloured only when it drops below 1x (the compressed copy is *larger* than the raw data — compression is doing nothing for that stream). - **Org footprint strip** in `OPageLayout`'s `#subnav`, deliberately **outside** the table: the list is server-paginated and these totals cover every stream type, so in the table's `#subheader` they would read as a summary of the visible rows. Same figures, labels, icons and formatters as the Home → Usage tiles. **Bug fixed along the way:** `compressed_size` / `index_size` were declared outside the row `map`, so a stream without `stats` inherited the previous row's numbers. Rows now carry raw per-row values and render `—` when a stat is absent, instead of a misleading `0 MB`. ## Pipelines — `web/src/components/pipeline/PipelinesList.vue` Signal: **operational state**. - **State** column (Errored / Paused / Active) built the same way as the Alerts reference, plus a selectable state strip and a matching row rail. Errored rows also show when they last failed — recency on the exception only. - The state facet is orthogonal to the existing type toggle group, so the two never express the same filter. - "Errored" is driven by `last_error`, which the backend expires via `ZO_PIPELINE_ERROR_RETENTION_MINS` (default 60 min), so the state clears itself and cannot get stuck. ## Cluster Nodes — `web/src/components/settings/Nodes.vue` Signal: **health**. - Health strip doubling as the status facet, **Status** chips, and a new **Role** column via a `nodeRole` badge group (roles were filterable but never displayed). - Node health previously relied on `status-row` / `status-*` row classes that **exist nowhere in the repo**, so status rendered no colour at all. Replaced with a real rail plus an exception tint. - CPU/memory bars now go amber at 70% and red at 85%, and a hardcoded literal colour (`bg-[lightgrey]`) is gone. - Replaced the fake `#` data column (a real, draggable, resizable column whose numbers stopped matching the rows once sorted or filtered) with `OTable`'s `show-index` gutter, and the positional `columns.splice(2, 1)` with a filter by column id. ## Shared - `OStatCard`: the **value no longer truncates** — a clipped `499.51…` is a useless number, so the label absorbs the squeeze instead. `OStatStrip` wraps a tile earlier so a five-tile strip stops squeezing on a laptop. - `formatEventCount` moved out of `UsageTab.vue` into `utils/formatters.ts`, so Home and Streams cannot disagree about the same number (`2.9B` vs `2,900,000,000`). - Streams list endpoint: `stream_comparator` gains `doc_time_max` and `compression` sort arms, with unit tests. ## Note on the two new sorts `Last Ingested` and `Compression` are intentionally **not sortable in the UI yet**. The table is `sorting="server"`, and an unknown sort key falls through to `_ => name` with no error — a sort control would silently order by name. Sorting them client-side isn't possible either: server pagination means the page holds 20 of N rows. The backend arms ship in this PR; enabling the columns is flipping `sortable: false` → `true` once a build carrying them is deployed (the column ids already match the keys). ## Testing - `npm run lint`, `lint:design:strict`, `lint:tokens`, `lint:token-purity`, `lint:styles`, `type-check` — all pass. - 285 unit tests across LogStream, PipelinesList, Nodes, UsageTab, formatters and badgeGroups pass. - The Rust arms and their tests have **not been compiled locally** (no cargo toolchain on the dev machine) — first real compile is CI. - Cluster Nodes needs an enterprise build **and** the meta org to be reachable (Settings → Nodes is gated `isEnterprise && isMetaOrg`). --------- Co-authored-by: ktx-vaidehi <vaidehi.akhani@kiara.tech> Co-authored-by: ktx-vaidehi <134508096+ktx-vaidehi@users.noreply.github.com> |
||
|
|
83d12fff04 |
feat(web): inline-rename page titles with auto-generated default names (#13520)
## What changed

Naming an alert, panel, workflow, pipeline or function meant inventing a
name up front in a form field before anything else could be configured.
Two pieces replace that.

**Inline rename** — the page title *is* the input. `OInlineEdit` /
`OFormInlineEdit` (`web/src/lib/forms/InlineEdit`): click to rename,
Enter or blur commits, Escape restores the pre-edit value. A `#trail`
slot carries the "Auto" badge in display mode only.

**Auto-generated names** — `utils/autoName.ts` builds the name,
`composables/useAutoName.ts` decides when it's allowed to win. A name is
AUTO until the user types, then it's theirs for good; clearing the field
and blurring re-arms auto. The generators describe only what is actually
configured, so a half-built panel yields a shorter name rather than a
speculative one, and an empty string when there is nothing to say.

- Panel names read as prose — `Avg of duration by service`, `Record
count`, `k8s_logs overview`. Both live panel-field shapes are handled
(builder `functionName` + `args`, and legacy flat `column` +
`aggregationFunction`); the time column is read from
`zoConfig.timestamp_column` rather than hardcoded. Hand-written queries
fall back to the stream, since naming a panel after `x_axis_1` is worse
than saying nothing.
- Alert names are identifiers — `anomaly_k8s_logs`,
`k8s_logs_status_gte_500` — built to survive the backend's
`RE_OFGA_UNSUPPORTED_NAME` rule, with operators spelled out and a
`slugify` backstop. A leading underscore is preserved so internal
streams (`_rumdata`) keep their names.

### Supporting library changes

| Component | Change |
| --- | --- |
| `OPageHeader` / `OPageLayout` | New `titleOverflow="visible"` — the
`<h1>`'s `truncate` clips an interactive title's focus ring and the
error message it floats below itself |
| `OSelect` | New `appearance="inline"` — borderless, no fixed height,
sized to content, for a value that reads as a word inside running text
("Add Alert **in KTX**") |

All new strings go through i18n (`common.inlineEdit.*`,
`dashboard.autoName.*`, `alerts.autoName.*`, per-module `renameHint`).
Interpolated identifiers — column names, SQL functions, stream names —
stay verbatim.

## Wired into

AddPanel, AddAlert (+ `useAlertForm`), WorkflowEditor, PipelineEditor,
Functions / FunctionsToolbar, IncidentDetailDrawer,
InlineSelectFolderDropdown.

## Tested

244 unit tests across the 5 affected suites, all passing — including new
specs for `OInlineEdit`, `useAutoName`, and `autoName`.

One pre-existing expectation in `autoName.spec.ts` was updated: it
asserted `Avg of duration, max of duration +1 more`, capitalising only
the first word of a multi-measure name. `measureLabel` capitalises per
measure by design, so the expectation now reads `Avg of duration, Max of
duration +1 more`.

---------

Co-authored-by: ktx-vaidehi <134508096+ktx-vaidehi@users.noreply.github.com>
Co-authored-by: ktx-vaidehi <vaidehi.akhani@kiara.tech>
|
||
 Dhruv Patel |
e85baca92d |
fix: logs timechart required-fields error and URL refresh failure (#13244)
## Summary Fixes #12897 — two defects on the Logs page **Timechart** tab: 1. The error **"Please select required fields to render the chart"** appeared even though the chart should render. 2. **Refreshing the URL** broke the tab entirely: a *"Select \* query is not supported for visualization"* toast plus a permanent **No Data** state. ## Root cause ### 1. False "required fields" error (regression) `convertPanelData()` throws this error when a chart-type panel has empty `x`/`y` fields. The check was introduced in #10305, then **commented out in #11297 specifically because it broke the logs visualize toggle** (the NOTE explaining that was left in the code), and then **re-enabled in #11586**, which reintroduced the bug. The Timechart drives a **custom-query** panel whose axes are populated *asynchronously* from the result schema (`resetFields()` → `result_schema` network call → repopulate). Empty `x`/`y` is therefore a legitimate transient state for this panel — any render that landed inside that window (or after an extraction early-exit) hit the throw and pushed the error into the errors panel. ### 2. URL refresh broken Two ordering problems on page load: - `handleBeforeMount()` restores `logsVisualizeToggle` from the URL **before** the stream selection is restored, so the visualize toggle watcher fired with an empty stream and built literally `select * from "undefined"` → rejected with the SELECT \* toast (confirmed by instrumenting the running app). - Nothing ever re-ran the visualization after URL restoration completed — `loadVisualizeData()` only loads stream fields — so the tab stayed on **No Data** forever. ## The fix | Change | File | What it does | |---|---|---| | Scope the empty-fields guard to builder-mode panels (`!query.customQuery`) | `web/src/utils/dashboard/convertPanelData.ts` | Builder panels keep the protection (the panel editor's own validation also still blocks empty applies); custom-query panels (logs Timechart, alerts preview) are no longer blocked by their transient empty-fields state | | Bail out of the visualize toggle watcher when no stream is selected yet | `web/src/plugins/logs/Index.vue` | Stops the premature page-load run from building `select * from "undefined"` and toasting | | Run the visualization after URL restoration completes | `web/src/plugins/logs/Index.vue` (`setupLogsTab`) | Mirrors the manual-toggle setup via a shared `prepareVisualizeMode()` (quick-mode auto-enable, layout, `customQuery`, VRL copy), restores the saved chart type/config from `visualization_data` (`restoreVisualizationFromUrlOnLoad()`), then triggers the run. Scoped to the visualize toggle only — Search/build/patterns tabs untouched | | Broaden the stream-field readiness check | `web/src/utils/logs/visualizeStreamFields.ts` (new) | Extracted predicate also reloads fields when quick mode is on but `interestingFieldList` hasn't loaded yet — the state that produced SELECT \* mid-restore | ## Verification - **Unit tests (written failing-first against the unfixed code):** guard skips custom-query panels / still throws for builder panels / PromQL exempt; readiness-predicate cases. 75/75 pass across the two touched suites. - **End-to-end (local backend + dev UI + Playwright):** reproduced both symptoms on the unfixed build, then verified on this branch: run → render; chart-type switch (h-bar) → URL refresh → **chart type + config + query restored and chart rendered, zero errors**; VRL-function variant renders; dashboards builder empty-fields apply is still blocked by its validation; build-tab refresh behavior unchanged. - `eslint` clean on all touched files (the one `no-fallthrough` error in `convertPanelData.ts` pre-exists on `main`, untouched line); `vue-tsc` clean. ## Before / After Both recordings follow the identical flow: select stream → `match_all('error')` → open Timechart → switch chart type to horizontal bar → **refresh the URL**. ### Before (`main`) — refresh shows the SELECT \* toast and permanent No Data 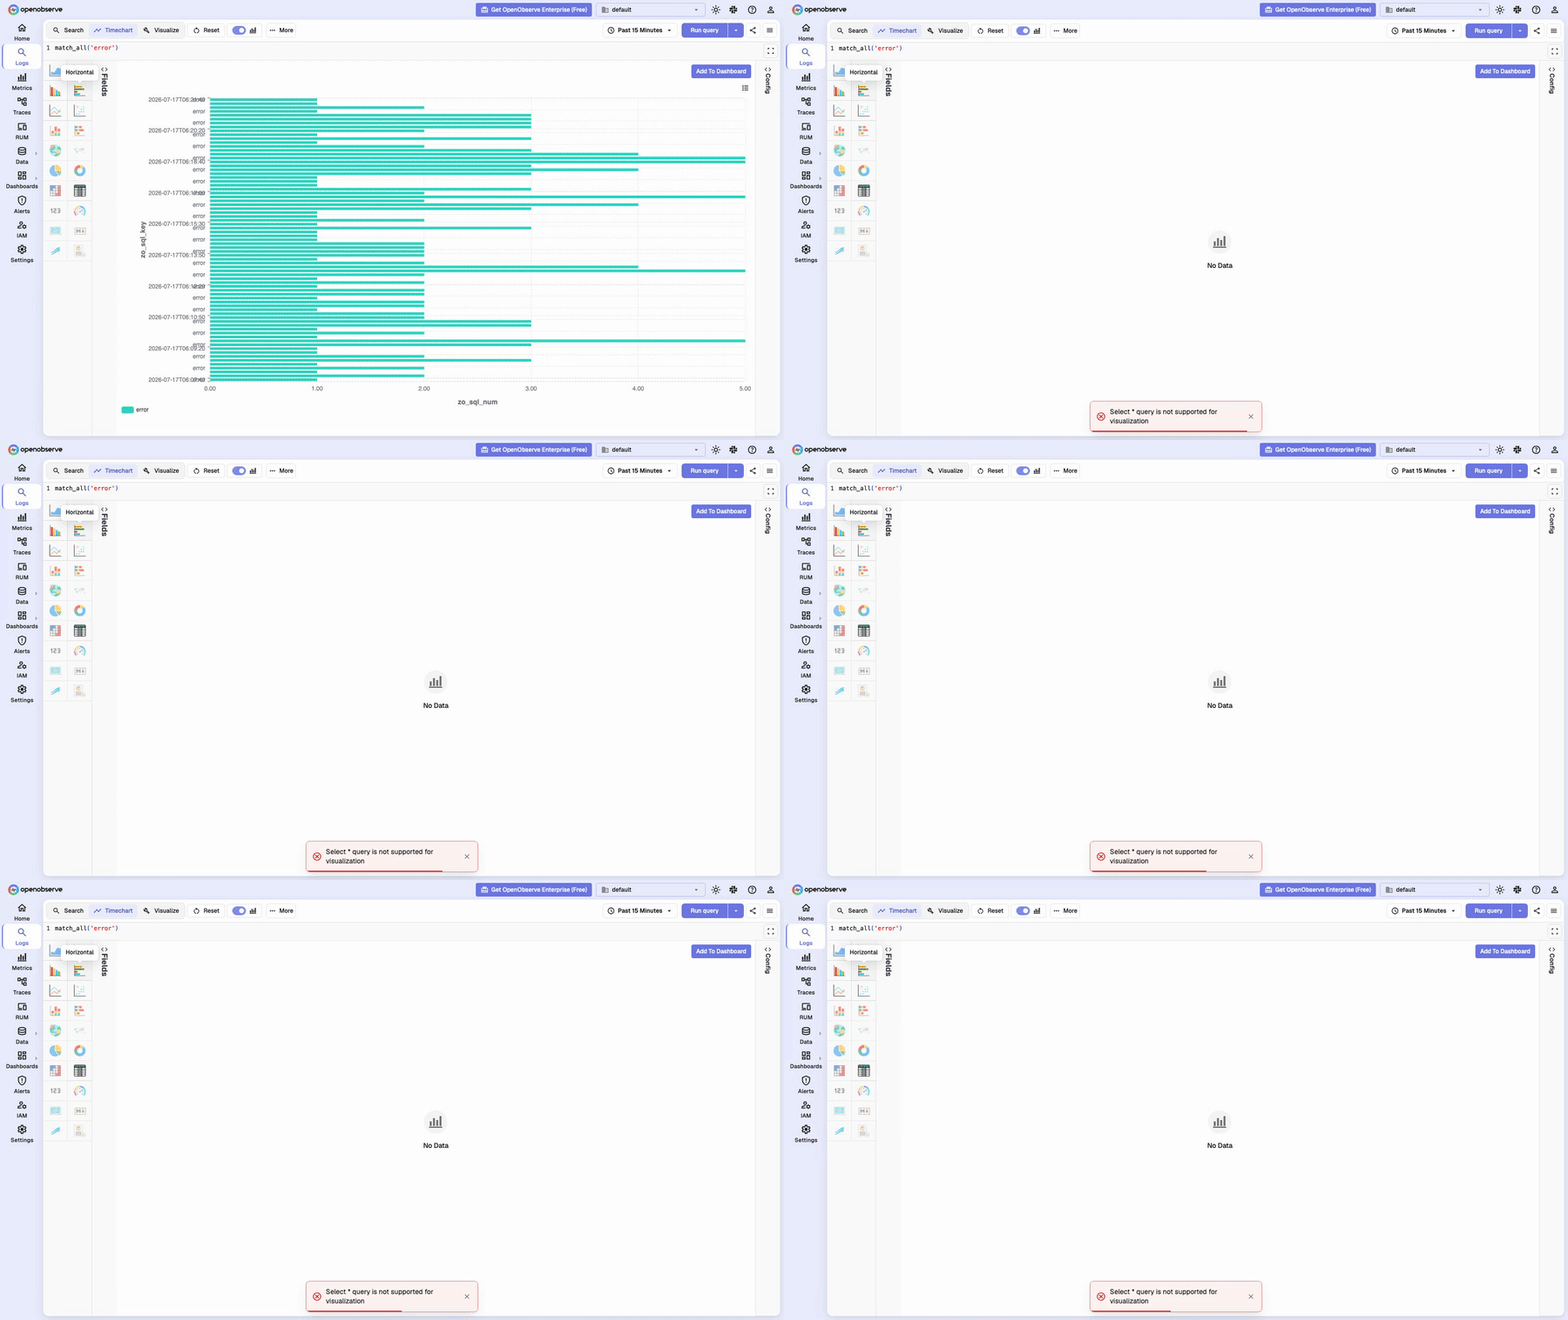 📹 Full recording: [before-refresh-bug.webm](https://raw.githubusercontent.com/DHRUV6029/openobserve/pr-12897-assets/before-refresh-bug.webm) ### After (this branch) — refresh restores chart type, query, and renders 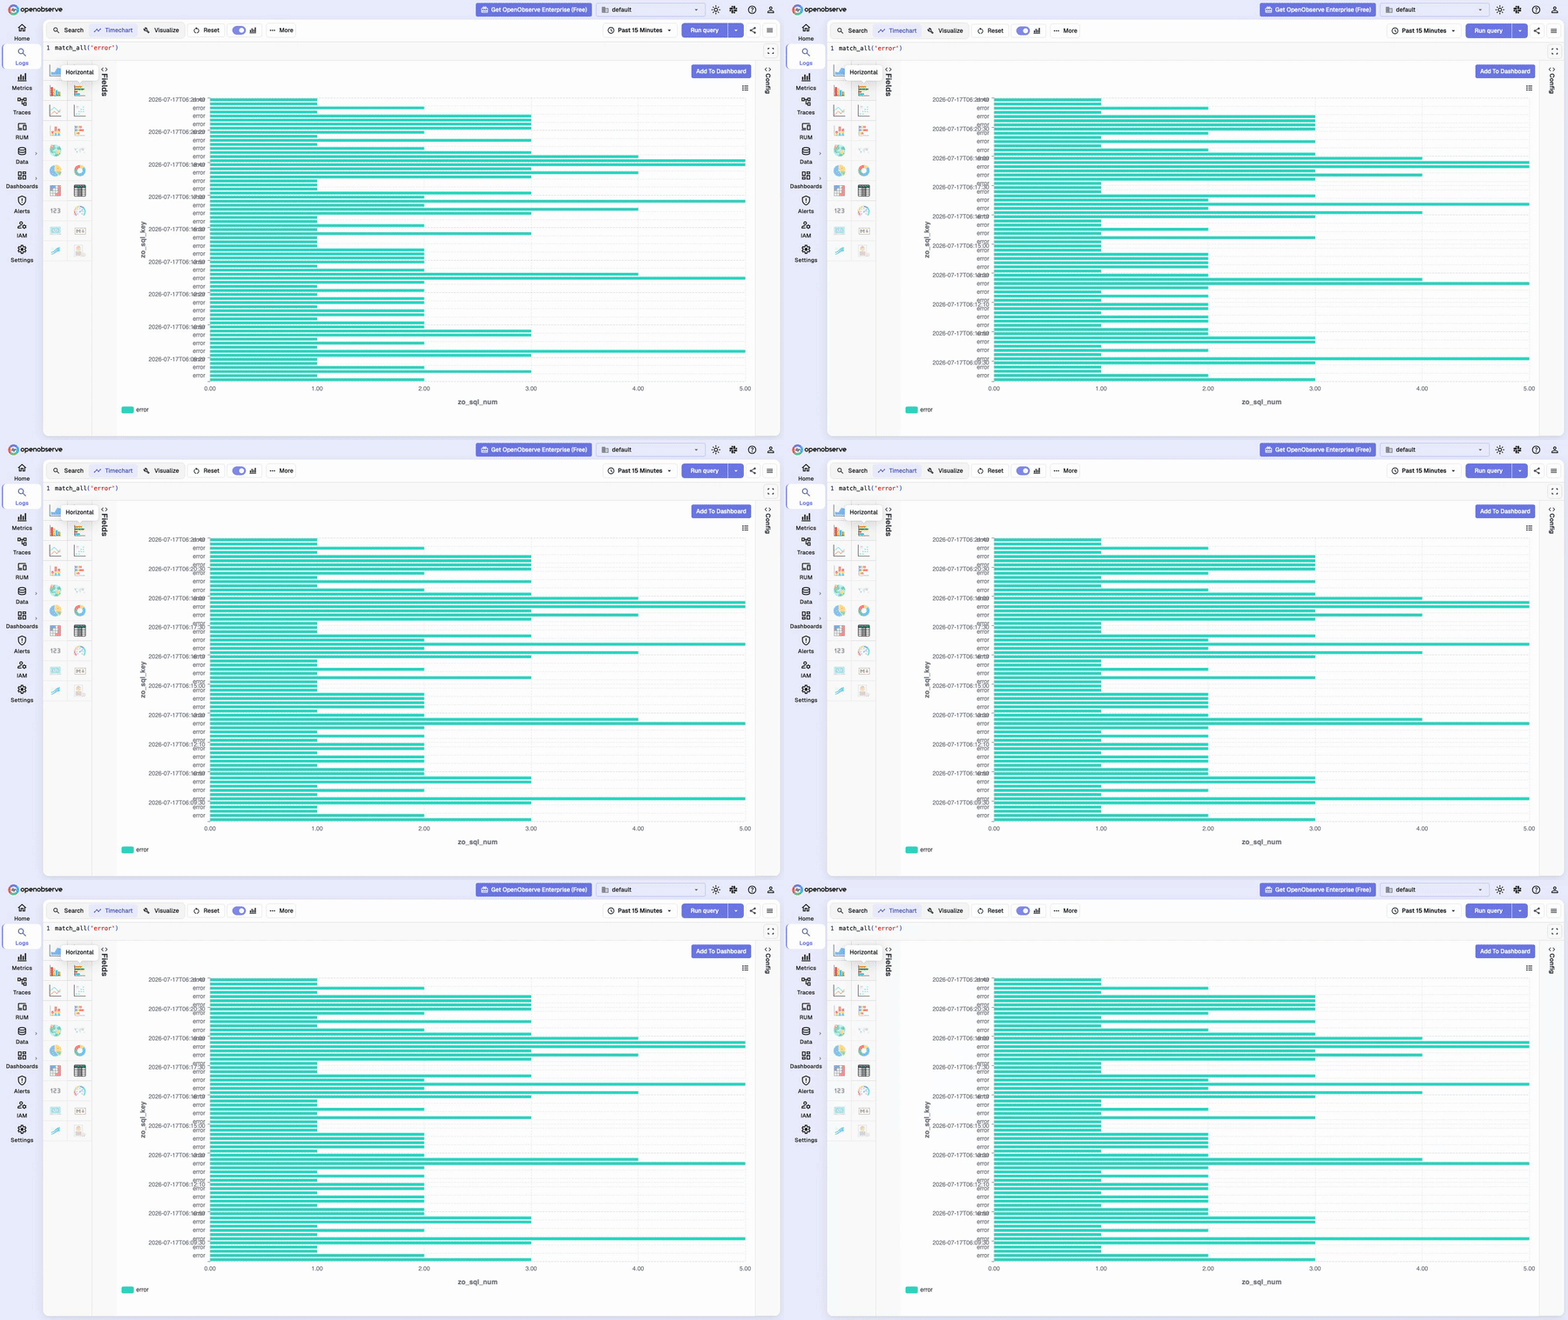 📹 Full recording: [after-fix-full-flow.webm](https://raw.githubusercontent.com/DHRUV6029/openobserve/pr-12897-assets/after-fix-full-flow.webm) <details> <summary>Screenshots — final states and pre-refresh states on both builds</summary> Final state after refresh (unfixed build): 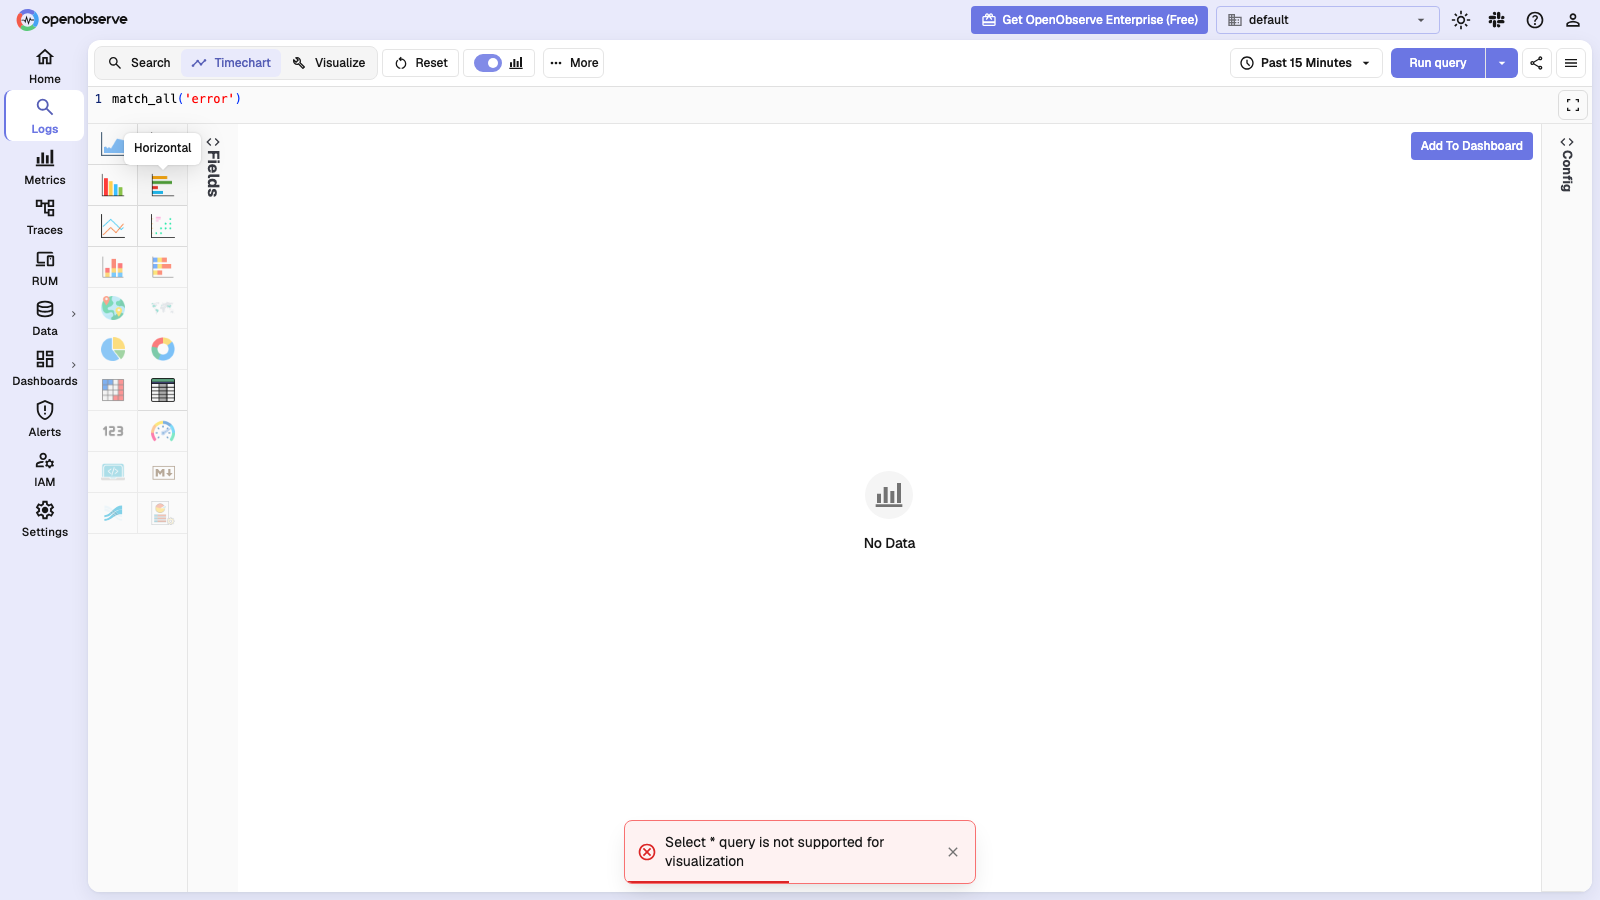 Final state after refresh (this branch): 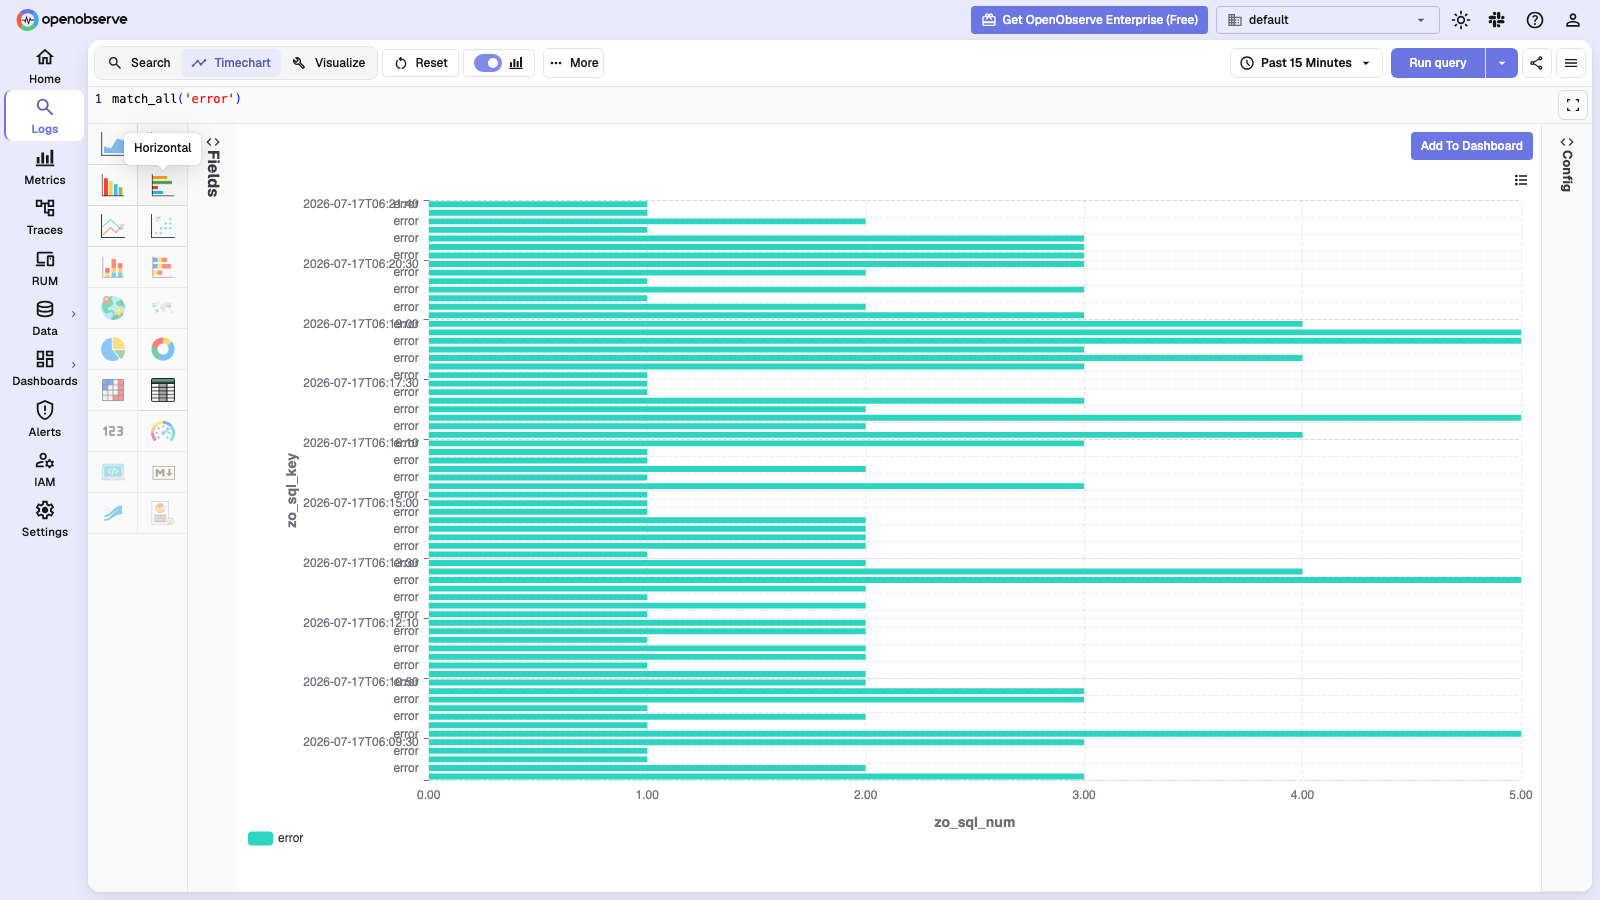 Timechart renders before refresh (unfixed build): 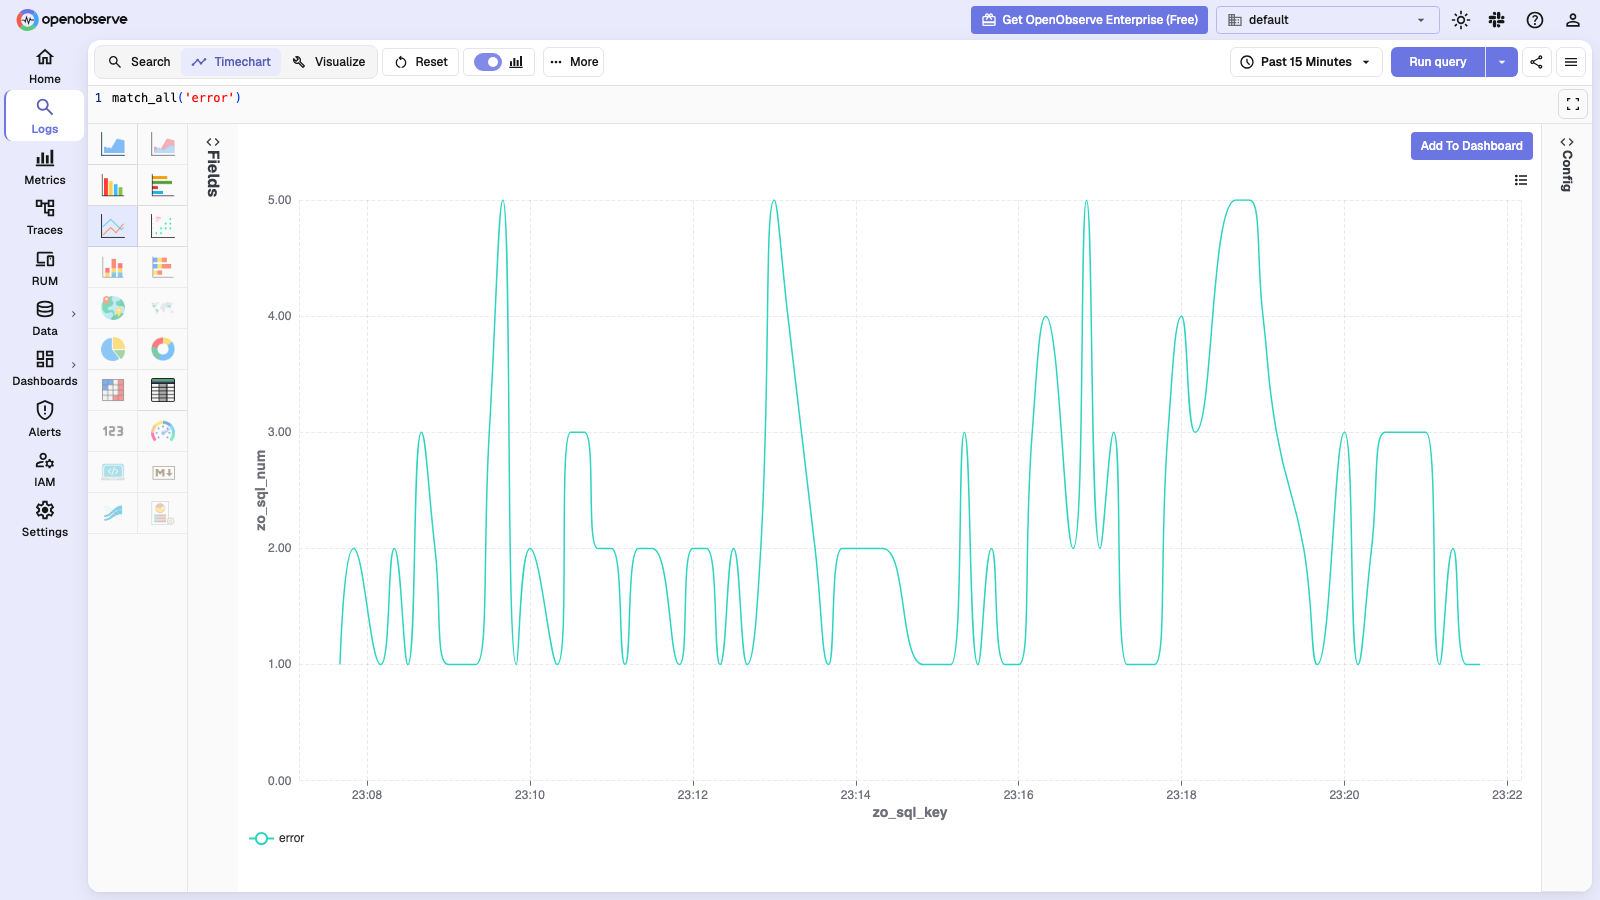 H-bar renders before refresh (unfixed build): 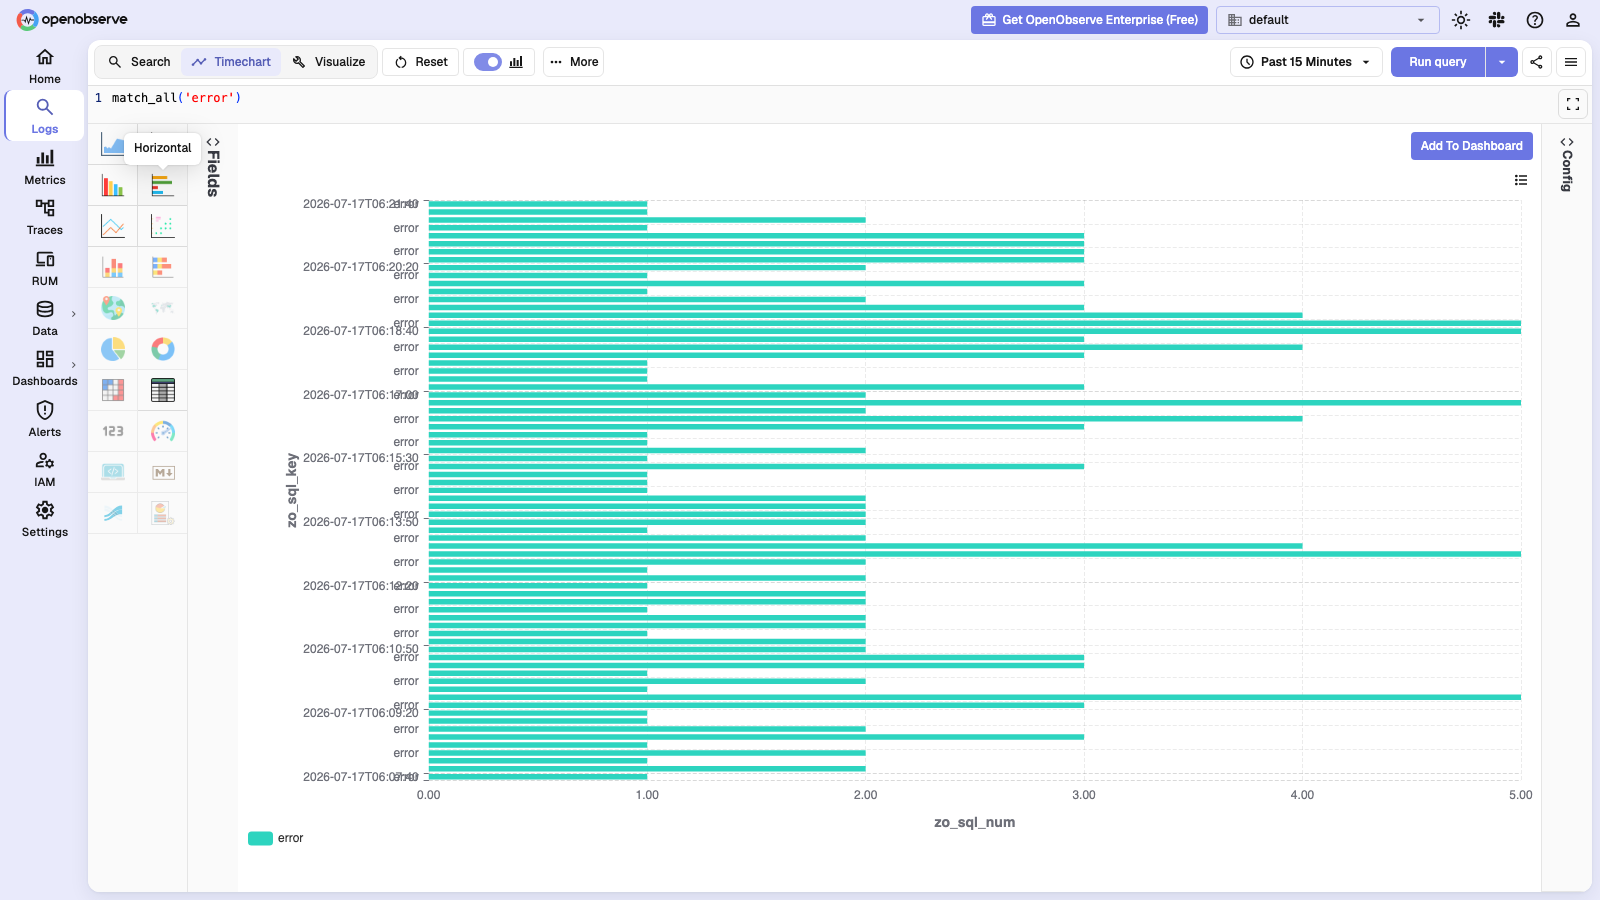 Timechart on this branch: 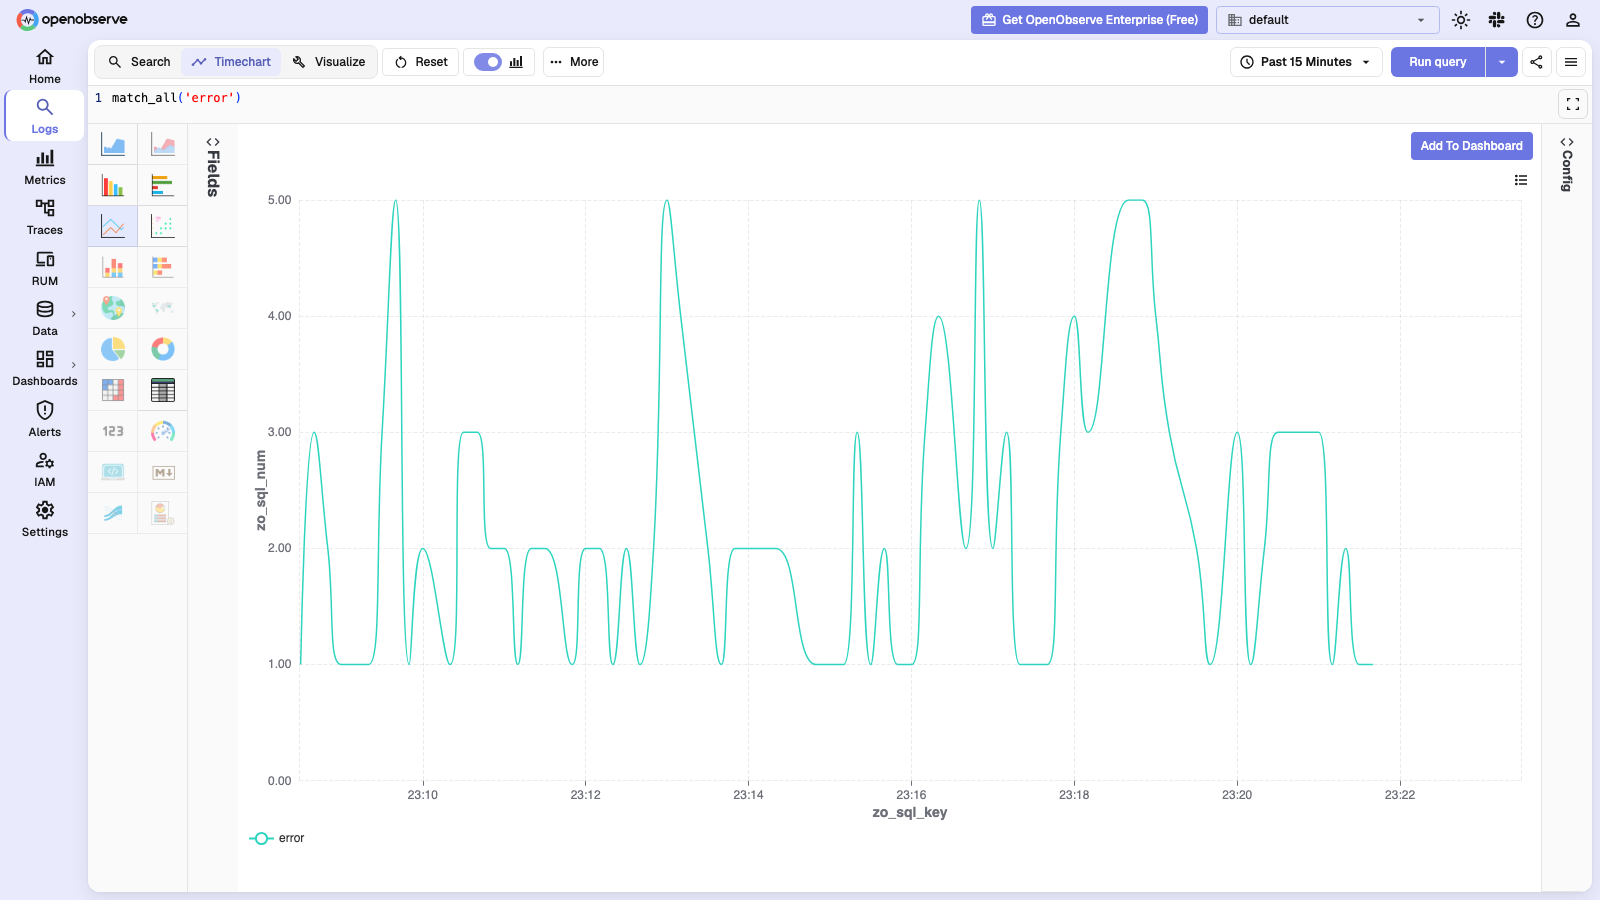 H-bar on this branch: 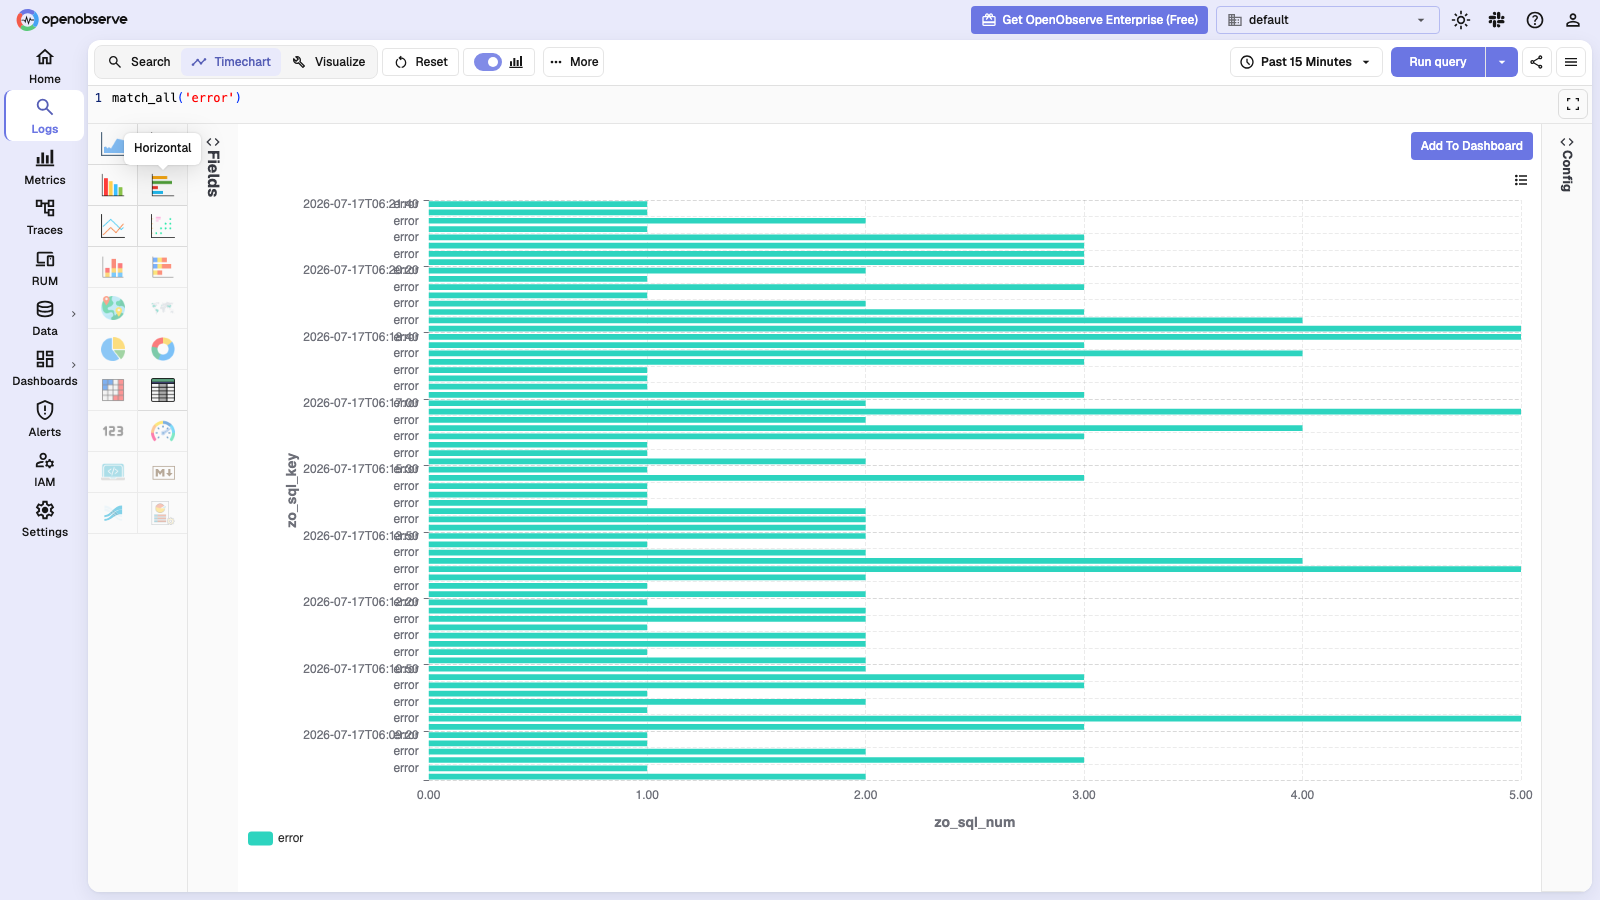 </details> |
||
|
|
4772df1723 |
feat: per-group and per-series alerting, and SLO measurement (#13547)
Design at: alerts_2.md Per-group and per-series alerting, SLO measurement, and the UI for both. ## Alerts **Multi-alerts (Feature 3).** A grouped alert can opt in to evaluating and paging **per group** rather than collapsing to one verdict. Opt-in only (`multi_alert`), so no existing alert changes behaviour: the flag cannot be present in JSON written before it existed. Per-group state, transitions, silence fingerprints, disappearance/reaping and a cardinality cap, with the count-gate rules that make "most severe group" and the legacy collapsed level provably the same verdict. **Per-series alerting for PromQL.** The same feature for the metrics family, where a group is one returned **series** keyed by its full label set — that is a series' identity in Prometheus, and the expression's own `by (…)` clause is already where the label set is chosen, so a second picker could only disagree with it. One additive nullable column; NULL means off, so stored alerts are untouched. **Alert detail page**, replacing the row-click side panel: stat strip, evaluation chart with threshold marklines, per-group table and history. Simple alerts get a real history too — evaluations (one record per run) by default, level changes alongside. ## SLOs Count / time-slice / alert SLIs, error-budget and burn-rate arithmetic, rolling windows, per-group slices with an exact rollup, coverage gating, backfill, and SLO-based alerts. Two capabilities the model could not express, both added tests-first: - **Metrics-native counting** (`CountSource::PromQl`) — counter metrics have no rows for a predicate to classify, so "good" exists only as arithmetic between series, and correct counter arithmetic is `increase()`. - **Freshness semantics** (`absent_is_bad`) — for a pipeline SLO, silence IS the failure, which the default gap rule can never report. A *failed* query still freezes rather than pages; only a query that PROVED emptiness counts as bad. **SLO form**: live good/bad preview so a wrong predicate is caught before saving rather than days later, real query editors with field autocomplete, folders shared with alerts, and a move endpoint. ## Notes for review - The SLO and composite features are **deferred (TODO)**: `ZO_SLO_ENABLED` stays default **false** and the SLOs menu entry is hidden until they ship; the SLO backend and UI remain in the tree behind the flag, and composites stay pure logic + tests. - One migration (schema 61): a nullable column for the PromQL opt-in. No backfill. - Two fixes outside the feature that it surfaced: query-editor completions were duplicated per mounted editor (Monaco registers providers per *language*), and the alert detail chart had no PromQL branch, so it charted row counts against the series-count gate. - Lands together with the matching o2-enterprise PR — `QueryType::Slo` is new here and the enterprise dedup matches are exhaustive over it. - `ratelimit::test_add_batch_missing_rule_id` fails intermittently on `main` as well; unrelated to this branch. --------- Co-authored-by: Shrinath Rao <shnath@openobserve.ai> Co-authored-by: hengfeiyang <hengfei.yang@gmail.com> Co-authored-by: sai nikhil kethe <nikhil@openobserve.ai> |
||
|
Prabhat Sharma
|
16bab4c700 |
fix(metrics): heatmap step unit, explorer back nav, gauge percentiles (#13557)
Four fixes to the metrics explorer and the panel editor it drills into. Each was reproduced from a real symptom; the root causes turned out to be independent. ## 1. Histogram heatmap rendered as a single column in the panel editor The same panel that renders correctly as a card collapsed to one full-width bar per bucket once opened in the editor. `usePanelPromQLExecutor` computed the heatmap step with `range / 1000`, but `startISOTimestamp`/`endISOTimestamp` are **microseconds**: - `plugins/metrics/Index.vue:294` documents `getConsumableDateTime()` as microseconds, and line 424 builds `meta.dateTime` from it with no conversion - `usePanelDataLoader.ts:412` preserves that magnitude via `.getTime()` - `usePanelVariableSubstitution.ts:410-412` reads the *same pair* and correctly divides by `1_000_000` So every range looked 1000x longer. A 15m window asked for a **7500s step over a 900s range** → Prometheus returned one sample per series → one bar per `le`. Now `max(15, ceil(900/120))` = 15s / 60 columns, matching the card. Only heatmaps were affected — every other chart type sends `step: "0"` and lets the backend choose. **Why this shipped:** the spec asserted the same wrong unit, feeding `1_700_000_000_000` ms — a value the loader never produces — so it passed while the product was broken. Rewritten to microseconds, with an assertion that no range collapses below 10 columns. ## 2. Browser Back from Visualize landed on Logs Explore → Visualize is entirely in-page (`mode` is a query param on the `metrics` route; `MetricsVisualize.vue` is a child component, not a route). The only URL write was `router.replace`, so the Explore entry was **overwritten** rather than stacked, and Back popped straight past the page to whatever preceded `/metrics` — reliably `/logs`, since `logsUtils.ts:519-528` pushes an entry per search. Mode transitions now `push`; filter, time-range and refresh edits still `replace` so they don't stack history. `syncVisualizeUrl` stays `replace` — it fires repeatedly while editing. The existing mode-only fast path (`MetricsExplorer.vue:1388-1392`) restores Explore without re-querying the ~40 cards. ## 3. Gauge percentiles all drew the same line `quantile(φ, v)` aggregates **across the series** present at each timestamp, so on a single-series gauge p50, p90 and p99 all return that series' own value — three identical lines under three legends. Switched to `quantile_over_time` — percentiles over **time**, which is the question a gauge actually poses and which stays meaningful at any series count. (Histogram percentiles still use `histogram_quantile`, correctly untouched.) Two constraints shaped this: - **A range vector may only be taken over a selector.** The NaN-guard retry rewrites the gauge selector into `(x and x > -Inf)`, and `(...)[5m]` doesn't parse — the hazard already documented at `metricDefaults.ts:586`. The subquery escape is closed too: `src/promql/src/engine.rs:281-299` rejects a non-matrix inner expression. So these queries are built from an unguarded `rawSel`. The guard still applies to every variant that can carry it (asserted in tests). - **The rate window is the wrong size for a quantile.** Sized for `rate()`'s two-sample need, it gave a 15m view a 1m window — four samples, where p90 (index 2.7) and p99 (2.97) interpolate between the *same* top pair and draw as one line. Percentiles now get `computePercentileWindow`: floored at the rate window (no gaps between evaluation points), targeting `MIN_PERCENTILE_SAMPLES (20) × scrape`, capped at `range / 4` (a wider window flattens the chart). | Range | Rate window | Percentile window | Samples | |---|---|---|---| | 15m | 1m | **3m45s** | 4 → **15** | | 1h | 1m | **5m** | 4 → **20** | | 6h | 3m15s | **5m** | 13 → **20** | | 24h | 12m15s | 12m15s | 49 (unchanged) | | 7d | 1h24m15s | 1h24m15s | 337 (unchanged) | At long ranges the floor dominates and nothing changes, correctly. A new `$__percentile_interval` panel variable mirrors all three bounds so the card and the panel it drills into resolve to the **same** window — asserted directly against `computePercentileWindow`. Without it the editor would have kept the narrow window and disagreed with the card, the exact failure `computeRateWindow`'s own doc warns about. ## 4. Multi-series charts were monochrome `fixed` resolves to `fixedColor[0]` for *every* series name (`colorPalette.ts:279`), and these charts carry no legend — so Percentiles and Min/Max drew every line in one colour: indistinguishable when they differ, and invisible when they coincide. Now `palette-classic-by-series` above one series; a single series keeps the card's accent colour. Hashing the series *name* keeps `p50` the same colour across re-renders and between the preview tile and the card. Verified `p50`/`p90`/`p99` and `min`/`max` land on distinct palette slots in both light and dark themes. Heatmaps are unaffected — `convertPromQLHeatmapChart.ts` uses a hardcoded `HEATMAP_VISUAL_MAP_COLORS` and never reads `config.color`. ## Testing - **15,743 passed, 0 failed** across `src/utils`, `src/composables`, `src/plugins/metrics`, `src/components/promql`, `src/components/dashboards` - `vue-tsc` and `eslint` clean on every changed file - New coverage: heatmap step at five ranges, mode-transition push/replace, percentiles-over-time shape, the NaN-guard/range-vector interaction, window bounds (including the invariant that the percentile window is never narrower than the rate window, across ranges and scrape intervals), card↔panel window agreement, and four colour-mode cases Two existing assertions were corrected: one pinned the old `quantile()` string, and the router mock's `push: vi.fn()` returned `undefined` where the real router returns a Promise. ## Not addressed A separate issue found while reviewing: `cache_hit_ratio` displays as ~8500%. `metricDefaults.ts:236` infers any `*_ratio` name as `percent-1` (0.0–1.0), whose formatter multiplies by 100, but that producer emits 0–100. The inference follows Prometheus/Grafana convention, so the fix is arguably in the emitter — and `FnOverride` currently has no unit field, so there's no UI escape hatch. Left out deliberately pending a decision. 🤖 Generated with [Claude Code](https://claude.com/claude-code) |
||
     
|
db2f0fb62a |
feat(synthetics): attempts view, evidence panel, alerting, concurrency (#13543)
> Note: this branch carries ~20 earlier synthetics commits. The alerting piece is ~280 lines and is cleanly separable if a smaller review is wanted. ## Backend — alert state - **Four columns on `synthetics`** (`consecutive_failures`, `last_alert_at`, `alerting`, `degraded_notified_at`), all defaulted so no backfill is needed - **`DB_SCHEMA_VERSION` 55 → 56** — without the bump the migrator short-circuits and the columns never appear - Guarded with `has_column` on **both** `up` and `down`: SQLite ignores `IF NOT EXISTS` on `ADD COLUMN`, and sea-query has no `drop_column_if_exists` - **Compare-and-swap** accessor (`update_alert_state_if`), because the caller does a read-modify-write with no transaction - `alerting` is a separate column because without it "recovered" cannot be told from "was never alerting" - **`synthetics_jobs::failing_locations`** — the notification previously had no location field, so a six-location check with one broken region could only say "the check is failing" - Distinct subject, headline, icon and colour for FLAKY vs DEGRADED, from one shared `locations_line` helper so Slack/plain-text/email cannot drift > The table is `synthetics`, not `synthetics_monitors` — the entity module is named after the concept but declares `table_name = "synthetics"`. Recorded at the `DeriveIden` so the next column addition doesn't repeat it. ## Performance — the step-stats panel fetched ~35 MB per load - **`recorded_steps` out of the 5000-row tally** — ~60% of payload; ~4 KB/row and near-identical within a config version, so an *aggregation* re-read the same definitions 5000 times. Still written to every record, because steps are editable and history must not be rewritten - **`retry_history` out too**, replaced by `retry_step_ids` scanned only over rows that actually retried - **Key step stats by `step_id`, not name** — a rename *split* one step into two rows; two steps sharing a name *merged* into one - **Single-pass sparklines** — was O(steps²) per row: ~2M iterations for a 20-step journey, ~50M for a 100-step one - **Flaky Rate could exceed 100%** — the fallback incremented the numerator without the denominator - **Label the real window** — a 1-min check × 2 locations × 4 device combos is 11,520 executions/day, so a 5000-row cap is ~10 hours of a "last 7 days" selection ## UI - **Attempts selector** in the run detail — costs no request, `retry_history` is already on the row. Labels are 1-based while `attempt` is 0-based - Each attempt resolves **its own** screenshots, trace and evidence bundle; a superseded attempt's live under an `attempt-N-` key - **Evidence panel** — parses `evidence.ndjson` per line, grouped by kind in severity order, chips with counts visible at zero, third-party dimmed not dropped, truncation stated, four distinct empty states - **Flaky / Degraded / Unstable tiles.** Unstable is partitioned by `(location, device, engine)` — aggregated, a check solidly broken in one region and healthy in five is indistinguishable from one intermittently broken everywhere. It measures *oscillation*, not badness - All flakiness tiles read **"—" at `retries = 0`**, never `0.0%`: a zero is a measurement, that is the absence of one - **`init_ms` and queue delay shown separately** — init was observed at 113,131 ms on a cold Lambda against a 243 ms check; unsubtracted, Lambda locations look permanently slower at every percentile - Steps and Evidence are sibling `OTabPanel`s — stacking them broke the drawer's scroll ## Bugs fixed during review - **`mapRetryHistory` guarded on `Array.isArray`** but the search API returns blob columns as JSON *strings*, so it returned `[]` for every real record — the attempts strip could never render, whatever the query selected. Same bug in `mapEvidence` and the `attempts` fallback - **`mapRunDetail` read `rawHit.attempt`**; the field is `attempts`. The count was 0 on every run - **`mapRetryHistory` hard-coded `status: "failed"`** — reported a flaky run's *passing* final attempt as a failure - **A superseded attempt's failing step rendered as a pass** — the compact timeline's `passed`/`failed` was never normalised to the `ok`/`fail` vocabulary every consumer tests for - **`failure_detail` is not a column** — OpenObserve flattens nested objects; naming the object is rejected by the search API - **The retry-attribution query named `status_reason` unconditionally.** That field only exists once something has been a `warning`, and the three step queries share a `Promise.all` — so one missing column emptied the *entire* Steps tab - **`fetchSchemaFields` returned an empty Set on failure**, which the gate reads as "the schema has no fields", silently degrading every optional column to a literal ## Lease correctness (added after review of the concurrency docs) Two corruption-class bugs, both of which double-count the alert failure streak this PR introduces. Included here rather than in the concurrency branch because they undermine *this* PR's own feature. - **The browser lease validation was per-device while the work is per-job.** `validate_browser_config` computed `(retries+1) x journey_budget + retries x wait` against the 900s lease, but the probe runs `browser_devices` **sequentially inside** the leased job and nothing multiplied by the combo count (`MAX_BROWSER_DEVICE_COMBOS = 12`). At defaults a plain **desktop + mobile** config is 1210s of work; validation computed 605s and allowed it. It then blew its 900s lease on **every run, forever**, with nothing failing at save. At the cap: 7260s vs 900s. The consequence is verbatim what the `LEASE_SECS` comment in `dispatcher/mod.rs` was written to prevent — *"the reaper would requeue mid-run and the journey would EXECUTE AGAIN — duplicate result records, multiplied browser cost, and false alerts caused by the reliability fix itself."* All three happen at two devices today, on the **managed** path, since browser is Lambda-only. > ⚠️ **Breaking validation change.** An existing 2+ device check will fail to save until its budget, retries or combo count comes down. The error now names the combo count as a lever. **Query dev and prod for `json_array_length(config->'browser_devices') > 1` before rolling out.** - **`ack_complete` had no status guard** — `WHERE id = $4` alone. A duplicate ack succeeded and the caller called `increment_jobs_done` again for one job: `jobs_done` overshot `job_count`, the run was declared complete on a **partial set**, and since this PR it also advanced `consecutive_failures` twice, so `alert_if_fails: 3` fires after two failures. Reachable today with no concurrency work: `aws-sdk-lambda` retries a timed-out `RequestResponse` invoke, re-executing a check already in flight. `AND status = 1` makes it idempotent, and `ack_complete` now returns `None` when it did not apply so the caller skips run accounting. Reaper reassignment is covered too, as of the concurrency work merged below: `AND claimed_by = $5`. ## Verification `vue-tsc` + `type-check:app` clean · Prettier + design ratchet clean · **711 synthetics tests** · `cargo check` clean · infra unit tests pass. Migration applied against a real SQLite metastore: `55 → 56`, all columns correct. Every drawer field verified against live ingested data. > `MonitorResults.spec.ts` fails on a pre-existing `storage.ts` import error — identical on a stashed tree. ## Requires o2-enterprise#2305 — the `AlertDecision` this consumes. Merge together; each is inert alone. --- # Also merged: probe concurrency (#13552) The concurrency branch merged into this one, so this PR now carries both. Everything below is a correctness fix — none of it is throughput work. ### The reaper never completed a run, on any path A run completes when `jobs_done` reaches `job_count`, and only three callers move that counter: the probe ack, the dispatcher's failed invoke, and the reaper. The reaper never did — including in `dead_letter_expired`, whose whole purpose is to report "we gave up after N attempts". It wrote a customer-visible error record into a run that then stayed open forever: no `completed_at`, and since this PR's alerting work, no `resolve_alert` either, so the failure streak never moved. The mechanism was `requeue_expired` ignoring `valid_until`. It reset a job to Pending, and `prune_stale` — later in the **same tick** — deleted it again, because `valid_until` is one interval (60s for a 1-minute check) while a lease is 300s+. `dispatch_attempts` never got past 1, so `MAX_DISPATCH_ATTEMPTS` was unreachable and the retry budget was dead code on the agent path. - requeue only while the job is still inside its window - dead-letter everything that can no longer report, tagged with why (attempts exhausted / window closed / never dispatched), so a dead agent does not read as an unresponsive probe - per-row compare-and-swap instead of SELECT-then-bulk-UPDATE; the reaper runs on every alert_manager node - increment **before** the ingest-token lookup, which returns early when an org has no token ### Every check's retry sequence is bounded by the lease Retries run *inside* the leased job. The browser path has checked this since `journey_budget_ms`; the protocol path never did, and its inputs were unbounded — the `5_000..=300_000` bound on `timeout_ms` is **browser-only**, so a TCP check with `timeout_ms: 3_600_000` saved fine. With the reaper now completing runs, the symptom is a wrong answer rather than a stuck one: the lease expires mid-flight, the reaper completes the run as Error, and the probe's real ack is rejected as stale. A passing check reports Error permanently. `timeout_ms=100s, retries=2, wait=30` needs 360s and hits it. `lease_batch` treats the client's `lease_secs` as a floor request, not the decision — both probes guess 300s, and a probe cannot know how long its own job may take. ### Guards on the ack, and on dispatch failure `AND claimed_by = $5` closes reaper reassignment. `claimed_by` is `Option` during rollout: an older probe acks without it and falls back to the status guard, so nothing is discarded. `fail_dispatch` had no status guard, so a dispatch judged failed *after* the probe acked reset a **completed** job to Pending — leased again, run again, duplicate result, `increment_jobs_done` twice. Third outcome `AlreadySettled` added; the dispatcher matches all three with no wildcard, so handling it is compile-time enforced. `limit` is now clamped before the query. It is cast to `u64`, where a negative wraps to ~1.8e19 and the LIMIT goes unbounded — one agent leasing the entire pending queue for its pool. Reachable from one mistyped env var. ### Queue backlog is observable `synthetics_pending_jobs` and `synthetics_oldest_pending_age_seconds`, per location and pool. `started_ts - scheduled_ts` already covered work that *ran*; a check nobody leased produces no record, so its backlog was invisible by construction. ## Before merging this to main The `timeout_ms` validation is a **breaking change for existing protocol configs**. It runs at create/update only, so nothing stops on deploy — but an over-budget check is rejected the next time someone edits it. Expected result is zero rows: `retries` of 0 or 1 cannot trip the budget rule at all, and the defaults sit at 10,000ms, 1.1% of the lease. ```sql WITH c AS ( SELECT id, org_id, name, synthetics_type, COALESCE((config->>'timeout_ms')::bigint, 10000) AS t, COALESCE((settings->>'retries')::bigint, 0) AS r, COALESCE((settings->>'wait_before_retry_secs')::bigint, 5) AS w FROM synthetics WHERE synthetics_type <> 'browser' ) SELECT id, org_id, name, t AS timeout_ms, r AS retries, w AS wait_s, (r + 1) * t + r * w * 1000 AS worst_case_ms FROM c WHERE t NOT BETWEEN 1000 AND 300000 OR (r + 1) * t + r * w * 1000 > 900000 ORDER BY worst_case_ms DESC; ``` Anything returned is a check that **cannot work today either** — fix the config rather than loosening the rule. ## Not done Wiring the reaper's now-completing runs to a **notification**. The send lives in a crate that depends on `o2_enterprise`, so the reaper cannot call up into it; it needs the send moved into `openobserve_core::synthetics` or a queue. No regression — before this, the run never completed, so there was no notification either. --------- Signed-off-by: Yashodhan Joshi <yjdoc2@gmail.com> Co-authored-by: omkark06 <omkar@zinclabs.io> Co-authored-by: Harsh Mahajan <115500013+007harshmahajan@users.noreply.github.com> Co-authored-by: Yashodhan Joshi <yashodhan@openobserve.ai> Co-authored-by: Yashodhan Joshi <yjdoc2@gmail.com> Co-authored-by: sai nikhil kethe <nikhil@openobserve.ai> Co-authored-by: Shrinath Rao <shnath@openobserve.ai> Co-authored-by: Claude Opus 4.8 <noreply@anthropic.com> |
||
|
|
6fb5eecdc5 |
fix: table migration to same components (#13451)
## What changed Every table in the app now renders through the shared `OTable` (`web/src/lib/core/Table`). Both legacy implementations are deleted — `components/TenstackTable.vue` and `plugins/logs/TenstackTable.vue` — for ~7,000 lines removed and one table behaviour contract instead of three. To get there, `OTable` gained: per-cell hover actions, per-column value filter, opt-in column close "x", sticky pivot total row + right-pinned total columns, pivot row-field cell merge, caller-owned pagination bar, delegated scroll (shared scroller with the logs/traces histogram), and variable-height virtual rows. ## Tables migrated | Area | Tables | | --- | --- | | Logs | Search results grid, correlated logs | | Traces | Search results grid, trace details sidebar (attributes / events / links), service graph node panel | | Dashboards | Table panel + pivot (incl. PromQL), panel pagination controls, import error panel | | RUM | Session player traces tab | | Pipelines | Scheduled pipeline SQL preview | ## Tested 775 unit tests across the 12 affected suites, all passing. Manually verified per table: - **Columns** — resize, reorder, close "x", persistence across reload; horizontal scroll on wide grids; wrap toggle with virtual scroll; client + 3-state server sort - **Pagination** — custom records-per-page, enabling pagination after mount, scroll-to-top on page change, no duplicate pager - **Logs** — FTS highlighting, row expand → JSON preview and its actions, hover actions + AI button, cell font / row density / status spine, histogram pinned while scrolling sideways - **Dashboards** — pivot multi-level headers, cell merge, sticky totals staying aligned under horizontal scroll, cell colouring (auto palette / value mapping / conditional rules / overrides), CSV + JSON export - **Traces, RUM, Pipelines** — events table expansion, error-row border, row click → trace navigation, SQL preview copy + send-to-AI --------- Co-authored-by: ktx-vaidehi <134508096+ktx-vaidehi@users.noreply.github.com> Co-authored-by: ktx-vaidehi <vaidehi.akhani@kiara.tech> Co-authored-by: Shrinath Rao <shnath@openobserve.ai> |
||
 IluckySiandHengfei Yang |
c278682cca |
feat(web): add categraf option in custom metric ingestion (#13466)
This PR adds categraf as a explicit custom metric ingestion. The configuration as follows: > [[writers]] > url = "http://localhost:5080/api/default/prometheus/api/v1/write" > basic_auth_user = "root@example.com" > basic_auth_pass = "o2oi_dMJ0RsB50MzVt2CVPCripths0WaGE832" <img width="3064" height="1162" alt="image" src="https://github.com/user-attachments/assets/189c3c96-441c-4476-8c31-943acaa788b0" /> <img width="3840" height="1862" alt="image" src="https://github.com/user-attachments/assets/0408704b-b1d1-4546-8d8b-86dd5895d8bc" /> Co-authored-by: Hengfei Yang <hengfei.yang@gmail.com> |
||
|
ktx-vaidehi
|
c9fc8d3b55 | fix: dashboard builder redesign (#13419) | ||
|
Abhay Padamani
|
5a0b10e7af |
fix: _timestamp alias migration (#13489)
## How `rewriteQueryTimestampAlias` works

Example query:

```sql
SELECT a AS _timestamp FROM t GROUP BY _timestamp
```

### Step 1 — walk the string, one token at a time
Move left to right, grouping characters into tokens (words, quotes,
punctuation). Keep a tiny bit of state: **"which clause am I in"** and
**"did I just see AS"**.

### Step 2 — update state on keywords, decide on `_timestamp`

| Token | State update | If it's `_timestamp`, decision |
|---|---|---|
| `SELECT` | clause = SELECT | — |
| `a` | — | — |
| `AS` | expectAlias = true | — |
| `_timestamp` (chars **12–21**) | — | in SELECT + just saw AS → **alias
definition** → record an edit |
| `FROM` | clause = FROM | — |
| `t` | — | — |
| `GROUP` | clause = GROUP | — |
| `BY` | (stay in GROUP) | — |
| `_timestamp` (chars **39–48**) | — | in GROUP + we saw an alias →
**reference** → record an edit |

### Step 3 — the edits we recorded (just notes, nothing changed yet)

```
edit 1: replace chars 12–22 with "ts"
edit 2: replace chars 39–49 with "ts"
```

That's it — the scan's only job is to find the **character positions**
of alias `_timestamp`s. It figures out positions itself (by tracking
clause state), instead of asking a parser for them.

### Step 4 — rebuild by copying the original + splicing

```
out  = sql.slice(0, 12)   → "SELECT a AS "
     + "ts"
     + sql.slice(22, 39)  → " FROM t GROUP BY "
     + "ts"
     + sql.slice(49)      → ""
```

Result: `SELECT a AS ts FROM t GROUP BY ts`

### Why this guarantees "only the alias changed"
Everything in the output comes from `sql.slice(...)` — literal copies of
the original — **except** the spliced `"ts"`. There's no re-generation
step (no parse/stringify), so nothing else *can* change.
|
||
|
Bhargav
|
e9596a10a3 |
feat: Mobile rum sdk v2 (#13503)
Design at: design/mobile-rum-sdk-evaluation/design-docs Backend changes exist to make the OpenObserve RUM intake accept the mobile SDK wire format alongside the existing browser format. src/api/src/handler/http/request/rum/ingest.rs 200 → 202 Accepted on /rum, /logs, /replay | ---> OpenObserve-family SDKs (which the mobile forks derive from) treat any non-202 as an unexpected error and drop the batch. #[serde(default)] on Event ---> Mobile replay omits creation_reason / index_in_view that the browser format sends. Multi-segment replay handling ---> Browser sends 1 segment + 1 event object; mobile sends N segment parts + one event JSON array. Handler now collects all segments, parses event as array-or-object, pairs them, emits NDJSON → one _sessionreplay row per segment. MAX_SEGMENTS=200, 16 MB decompressed cap via .take() ---> Decompression-bomb guard, newly needed now that N segments are accepted. |
||
|
Abhay Padamani
|
f13e28a46e |
fix: dashboard and metrics page label overlap issues (#13450)
<img width="1172" height="482" alt="image" src="https://github.com/user-attachments/assets/3a49a47a-15c8-4eda-8044-ecca31d6eaf7" /> <img width="721" height="128" alt="image" src="https://github.com/user-attachments/assets/6cdf5b58-c71b-47a5-b92a-ae76f76867d7" /> <img width="167" height="225" alt="image" src="https://github.com/user-attachments/assets/dd0fa886-0e22-45ca-89d0-a8254a67e70d" /> <img width="215" height="234" alt="image" src="https://github.com/user-attachments/assets/19109ee0-0f02-47e3-b16f-e8c28b76bb8d" /> <img width="215" height="230" alt="image" src="https://github.com/user-attachments/assets/ed1777b4-53be-4279-aab3-0ca1910b1050" /> |
||
|
Abhay PadamaniandClaude Opus 4.8
|
5ec9b89ff8 |
build: FE code format check for improved maintainability (#13351)
Co-authored-by: Claude Opus 4.8 (1M context) <noreply@anthropic.com> |
||
|
Bhargav
|
6ba66d7f08 |
fix(logs): full-width row borders, table-owned scroll, histogram top … (#13435)
The results table sized each virtual row to its own text (w-max), so row bottom-borders stopped at the end of each line and the shared histogram+table scroll container gained a horizontal scroll that dragged the histogram off, leaving a blank strip. - Size the table to its widest rendered row (measured, rAF-throttled) so every row spans the full scrollable width and borders run edge to edge; the unwrapped source cell keeps its full text (no ellipsis) and scrolls. - Pin the histogram and give the logs table its own scroll box (drop the delegated scroll-el); both scrollbars now belong to the table, so horizontal scroll can't move the chart. Patterns view keeps the combined scroll. - Remove the window-derived width prop and the dead tableRowSize measuring loop. - Bump histogram grid.top 5 -> 8 so the top y-axis label isn't clipped. |
||
|
Shrinath RaoandClaude Opus 4.8
|
c122fbf9dc |
fix(logs): stop lazy-editor's transient empty emission wiping restored share-link query (#13426)
## The bug
Opening a **shared link** to an SQL search intermittently lands on an
**empty query editor** ("SQL query is missing or invalid"). Recurring
Logs-Features alpha flake: `monaco-query-prefill` P0 / `shareLink` P1 →
*"query editor never contained SELECT."*

Follow-up to #13414 — that PR guarded a plausible path (the
`fullSQLMode` watcher's "switch ON"), but the trace after it deployed
showed the query **still** dropped. This finds and fixes the actual
cause.

## Root cause (trace-confirmed)
The Monaco query editor is **lazy-loaded**. After the short-URL restore
sets the SQL query, the editor fires its change callback with an empty
`""` **while it mounts — before the restored value is applied.**
`SearchBar.updateQueryValue()` treated that transient empty as a real
edit:

```js
searchObj.data.editorValue = value;   // "" overwrites the restored query
searchObj.data.query = value;
if (value.trim() === "" && searchObj.meta.sqlMode === true) {
  searchObj.meta.sqlMode = false;     // → SQL mode auto-detects OFF → editor cleared for good
}
```

Under load the editor's empty emission lands *after* the restore, so the
query is lost. The trace shows the URL ending `sql_mode=false` with the
`query` param gone — exactly this.

## The fix — state-based, not a timer
The editor emits `""` *because it isn't ready yet*. So we gate on
**readiness (state)**, not a wall-clock wait (a fixed delay would just
change the odds, like "make the env faster"):

- `restoreUrlQueryParams()` sets `meta.pendingUrlQueryRestore = true`
when it restores a non-empty query.
- `updateQueryValue()` **ignores an empty emission while that flag is
set**, and clears the flag the instant the real (non-empty) value lands
— so genuine user clears *after* load still work. This mirrors the
existing `loadingStream` guard already in that function.

Because it keys off state, the race can't beat it: no matter *when* the
empty emission arrives, it's ignored until the real value is in.

## Verification
- ✅ **New real unit test** on `restoreUrlQueryParams`
(`useLogs.spec.ts`, actual composable) — asserts the base64 query
decodes into state, SQL mode restores, and `pendingUrlQueryRestore` is
set. **7 passed.**
- ✅ The guard is deterministic by construction (reads the same shared
`searchObj.meta`).
- ⚠️ The load-race is only observable against a **deployed** frontend,
so the final "flake gone on alpha under load" confirmation is a re-run
once this is deployed to alpha. (I was wrong once here — so I'm being
explicit that this last step is pending, not assumed.)

## Note
#13414's guard is left in place — it's a valid defensive symmetry fix,
just not the operative cause. This PR is the operative fix.

🤖 Generated with [Claude Code](https://claude.com/claude-code)

Co-authored-by: Claude Opus 4.8 <noreply@anthropic.com>
|
||
|
ktx-vaidehiandClaude Opus 4.8
|
50d3fda602 |
fix: UI token change (#13315)
Co-authored-by: Claude Opus 4.8 (1M context) <noreply@anthropic.com> |
||
|
ktx-vaidehiandClaude Opus 4.8
|
8886a03b99 |
feat(dashboards): redesign panel config sections (#13371)
- Collapse all config sections by default (was expanded) - Add open-state accent to OCollapsible sidebar variant: left accent bar, tinted header, and accent-colored icon/chevron when expanded - Move sidebar chevron to the right of the label (rotates on open) - Give every config section a leading icon via SECTION_ICONS - Add theme-aware collapsible open-state tokens (light + dark) --------- Co-authored-by: Claude Opus 4.8 <noreply@anthropic.com> |
||
|
Abhay Padamani
|
a237306208 |
feat: copy paste support for date time picker (#13374)
Design At: ui/datetime-picker-copy-paste.md <img width="399" height="561" alt="image" src="https://github.com/user-attachments/assets/d4c11056-ffe2-451f-8d1b-ddbcf7c59336" /> |
||
|
Prabhat Sharma
|
d2f279ec04 |
fix(ingestion): add macOS host agent and uninstall path to Data Sources (#13342)
## What

Two gaps in **Data Sources → Recommended**, both cases where the agent
scripts already existed but nothing in the product reached them:

1. **macOS was missing entirely.** `openobserve/agents` ships
`mac/install.sh`, but Linux and Windows were the only host agents in the
UI, so Mac users had no path from the product.
2. **No uninstall anywhere.** `linux/uninstall.sh`,
`windows/uninstall.ps1` and `mac/uninstall.sh` all exist and were
reachable from nowhere.

## macOS card

Sits between Linux and AWS in the sidebar, reusing the existing
`osAgent` scaffolding (install code block, host-metrics detection,
shared troubleshooting). Two deliberate differences from its siblings:

- **No generic/EC2 toggle.** There is no `mac/ec2` script, so it is a
single command — and the EC2-only troubleshooting row ("hosts show up
under an instance id") is dropped, since it cannot apply.
`sharedAgentTroubleshooting` gained an `includeEc2` flag; Linux/Windows
behaviour is unchanged.
- **The unified log needs a bridge.** It is not a file any collector can
tail, so the installer registers a second launchd daemon piping `log
stream --style ndjson` into the agent over loopback TCP. Troubleshooting
covers that daemon specifically, plus the volume knobs and the fact that
an *empty* `collector.err` is expected rather than a symptom.

## Uninstall

New `extras.uninstall`, rendered as the **last** collapsed accordion —
below troubleshooting — so a destructive action stays clear of the setup
flow while living on the page that installed the thing.

I deliberately did not reuse `extras.advanced`, whose documented
contract is "an alternative manual path to the *same* result"; uninstall
is the opposite, and Kubernetes already uses that slot for its manual
Helm sequence.

One script per OS covers both the generic and EC2 installs (there are no
EC2-specific uninstall scripts). All three raw URLs verified to return
200.

## Icon

`images/common/macos.png` is a neutral-grey Apple mark derived from the
existing `rum/mac.png`. That asset is solid black, and the sidebar tab
has no dark-mode inversion mechanism (unlike variant icons, which have
`iconInvertDark`), so a black mark would have been invisible in dark
mode. One asset that reads on both themes.

## Testing

- **2,410 tests pass across 749 suites**, including 6 new macOS content
tests and 4 new renderer tests.
- One renderer test mounts a card whose *only* extra is `uninstall`,
which catches forgetting the `.c-more` visibility guard.
- Extended the existing guard that every accordion icon is registered in
`OIcon` (an unregistered name silently degrades to raw text beside the
label) to cover the new `delete-outline`.
- `npm run type-check`: 0 errors. `eslint`: clean.
- `routeTabMaps.spec.ts` had a hard-coded `recommended has 9 entries` →
updated to 10. That is the only pre-existing assertion touched.

**Not verified:** I have not seen this render in a browser — it needs a
running backend and login. Worth a reviewer eyeballing the tab, the icon
contrast in dark mode, and the accordion order.

## Found while here (not fixed in this PR)

Two pre-existing bugs in the adjacent card content, both predating this
change:

1. **Linux and Windows cards name a service that does not exist.** They
tell users to run `systemctl status openobserve-agent` / `Get-Service
-Name openobserve-agent`, but the installers register
**`otel-collector`** (`linux/install.sh:114,132`,
`windows/install.ps1:31`) — `openobserve-agent` is the Linux *user
account*, not the service. So the primary "most likely fix" snippet on
both cards returns "Unit openobserve-agent.service could not be found".
The new macOS card uses the real launchd labels.
2. **`windows/uninstall.ps1` never deregisters the service** (agents
repo). It stops the service and deletes the install dir but has no
`sc.exe delete`, so the registration survives pointing at a deleted
binary — and since `windows/install.ps1` calls `New-Service` without
removing an existing one, uninstall → reinstall fails. The accordion
copy describes what the script actually does, not what it ought to.

Happy to take both in follow-ups.
|
||
|
Omkar KesarkhaneandClaude Opus 4.8
|
80be88a396 |
fix: synthetics UI issues (#13352)
## What changed

Fixes UI issues in OpenObserve's Synthetics monitoring section: label
corrections ("Synthetic" → "Synthetics"), validation feedback (toast +
OForm thread-through), step editing data-loss bugs (wire sync,
buildWireFromStep), replay banner cleanup, retries extraction into its
own component, and URL display in RunDetail step expansion.

## Why

Each fix addresses a specific user-reported or observed defect — steps
that silently dropped edits on save, validation errors that gave no
visual feedback, a banner that persisted after deleting all steps, and
incorrect label/URL display in sidebar, headers, and run detail views.

---------

Co-authored-by: Claude Opus 4.8 (1M context) <noreply@anthropic.com>
|
||
|
Abhay Padamani
|
db1da2f096 |
fix: MetricCardChart to use PanelSchemaRenderer (#13380)
- Replaced ChartRenderer with PanelSchemaRenderer in MetricCardChart.vue for consistent rendering. - Updated MetricCardChart.spec.ts to assert the panel schema and injected data correctly. - Introduced applyMeasuredYAxisLeftInset utility to adjust y-axis label spacing based on content width. - Enhanced convertPromQLData to call applyMeasuredYAxisLeftInset before returning options. - Added tests for applyMeasuredYAxisLeftInset to ensure correct behavior with various configurations. - Implemented compact preview adjustments in heatmap charts to optimize rendering in metrics explorer cards. |
||
|
Loakesh Indiran
|
9d70e0e905 |
feat(synthetics): private locations — check-form picker, agent identity, install flow (#13308)
Design at: https://github.com/openobserve/designs/tree/main/synthetics |







